Scores
What Are Scores?
Scores in Pocus help you prioritize the right user and accounts by combining key signals, traits, and AI events into a single, unified metric. These metrics—called Scores—are customized to reflect what matters most to your team, such as product engagement, customer fit, or buying intent.
Think of scores as a way to answer: Who should I focus on right now—and why?
You can create different scores for different teams (e.g., SDRs vs. AEs), and for any object in your workspace (e.g., Company, User, Team, etc.). Most notably, the configuration and presentation of scores are powered by generative AI to help identify key inputs to the score, balance them, and explain why they matter.
Watch a walk through here!
📊Creating Scores
1. Creating a new score
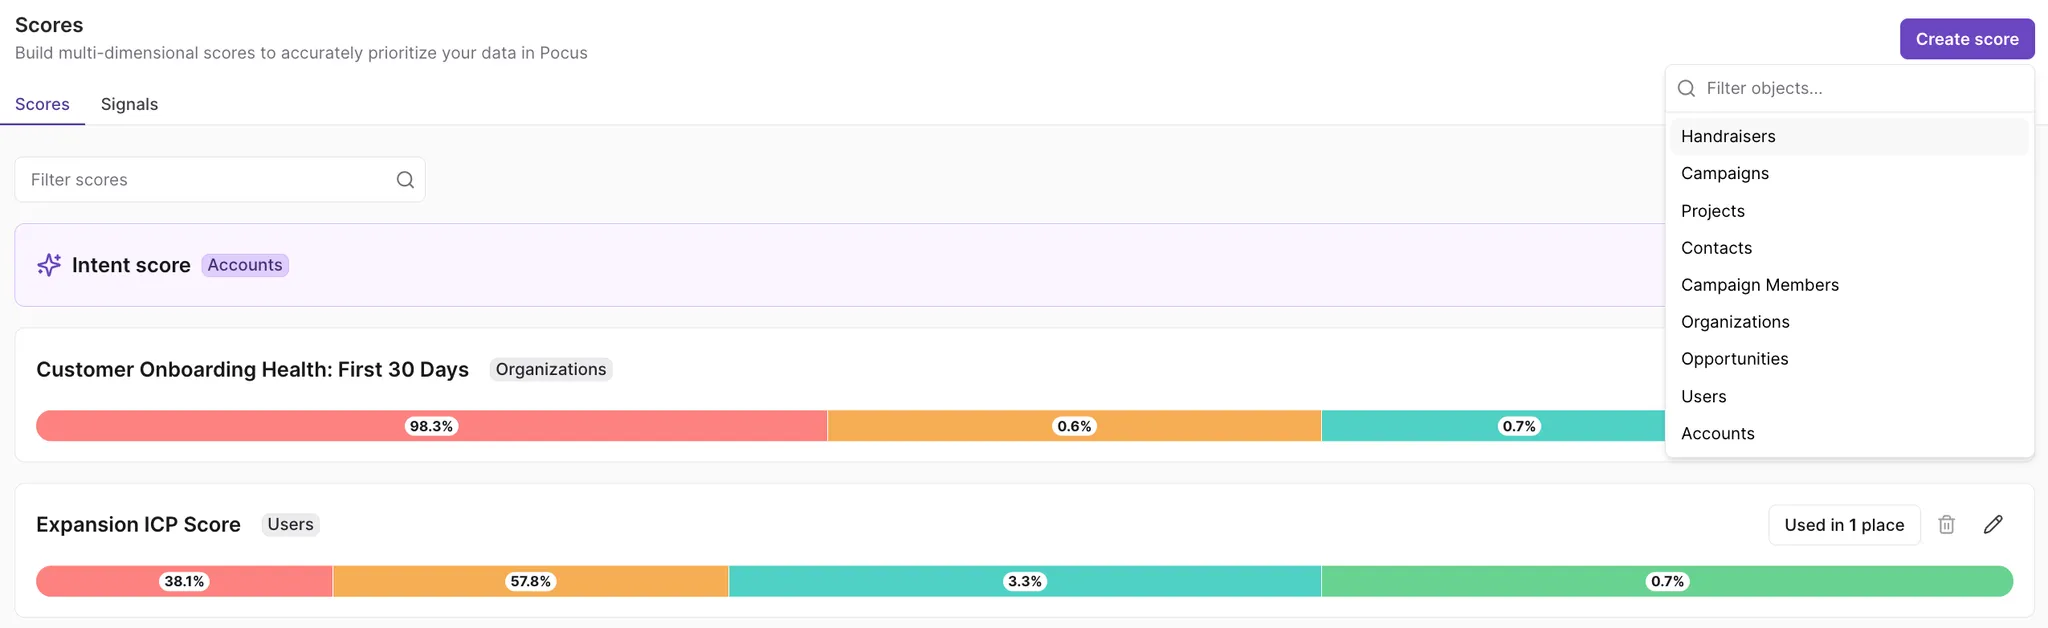
Creation of a new score is accessible from Workspace Settings > Scores. (Or, use Cmd + K and search “Scores.”) To create a new score, select Create Score and choose the desired object (such as Accounts to create an Account based score).
Once an object is selected, you will be presented with a popup to provide additional information about the score you are looking to create. Our AI will leverage the information you input here, along with its understanding of your workspace, to help configure your score automatically.
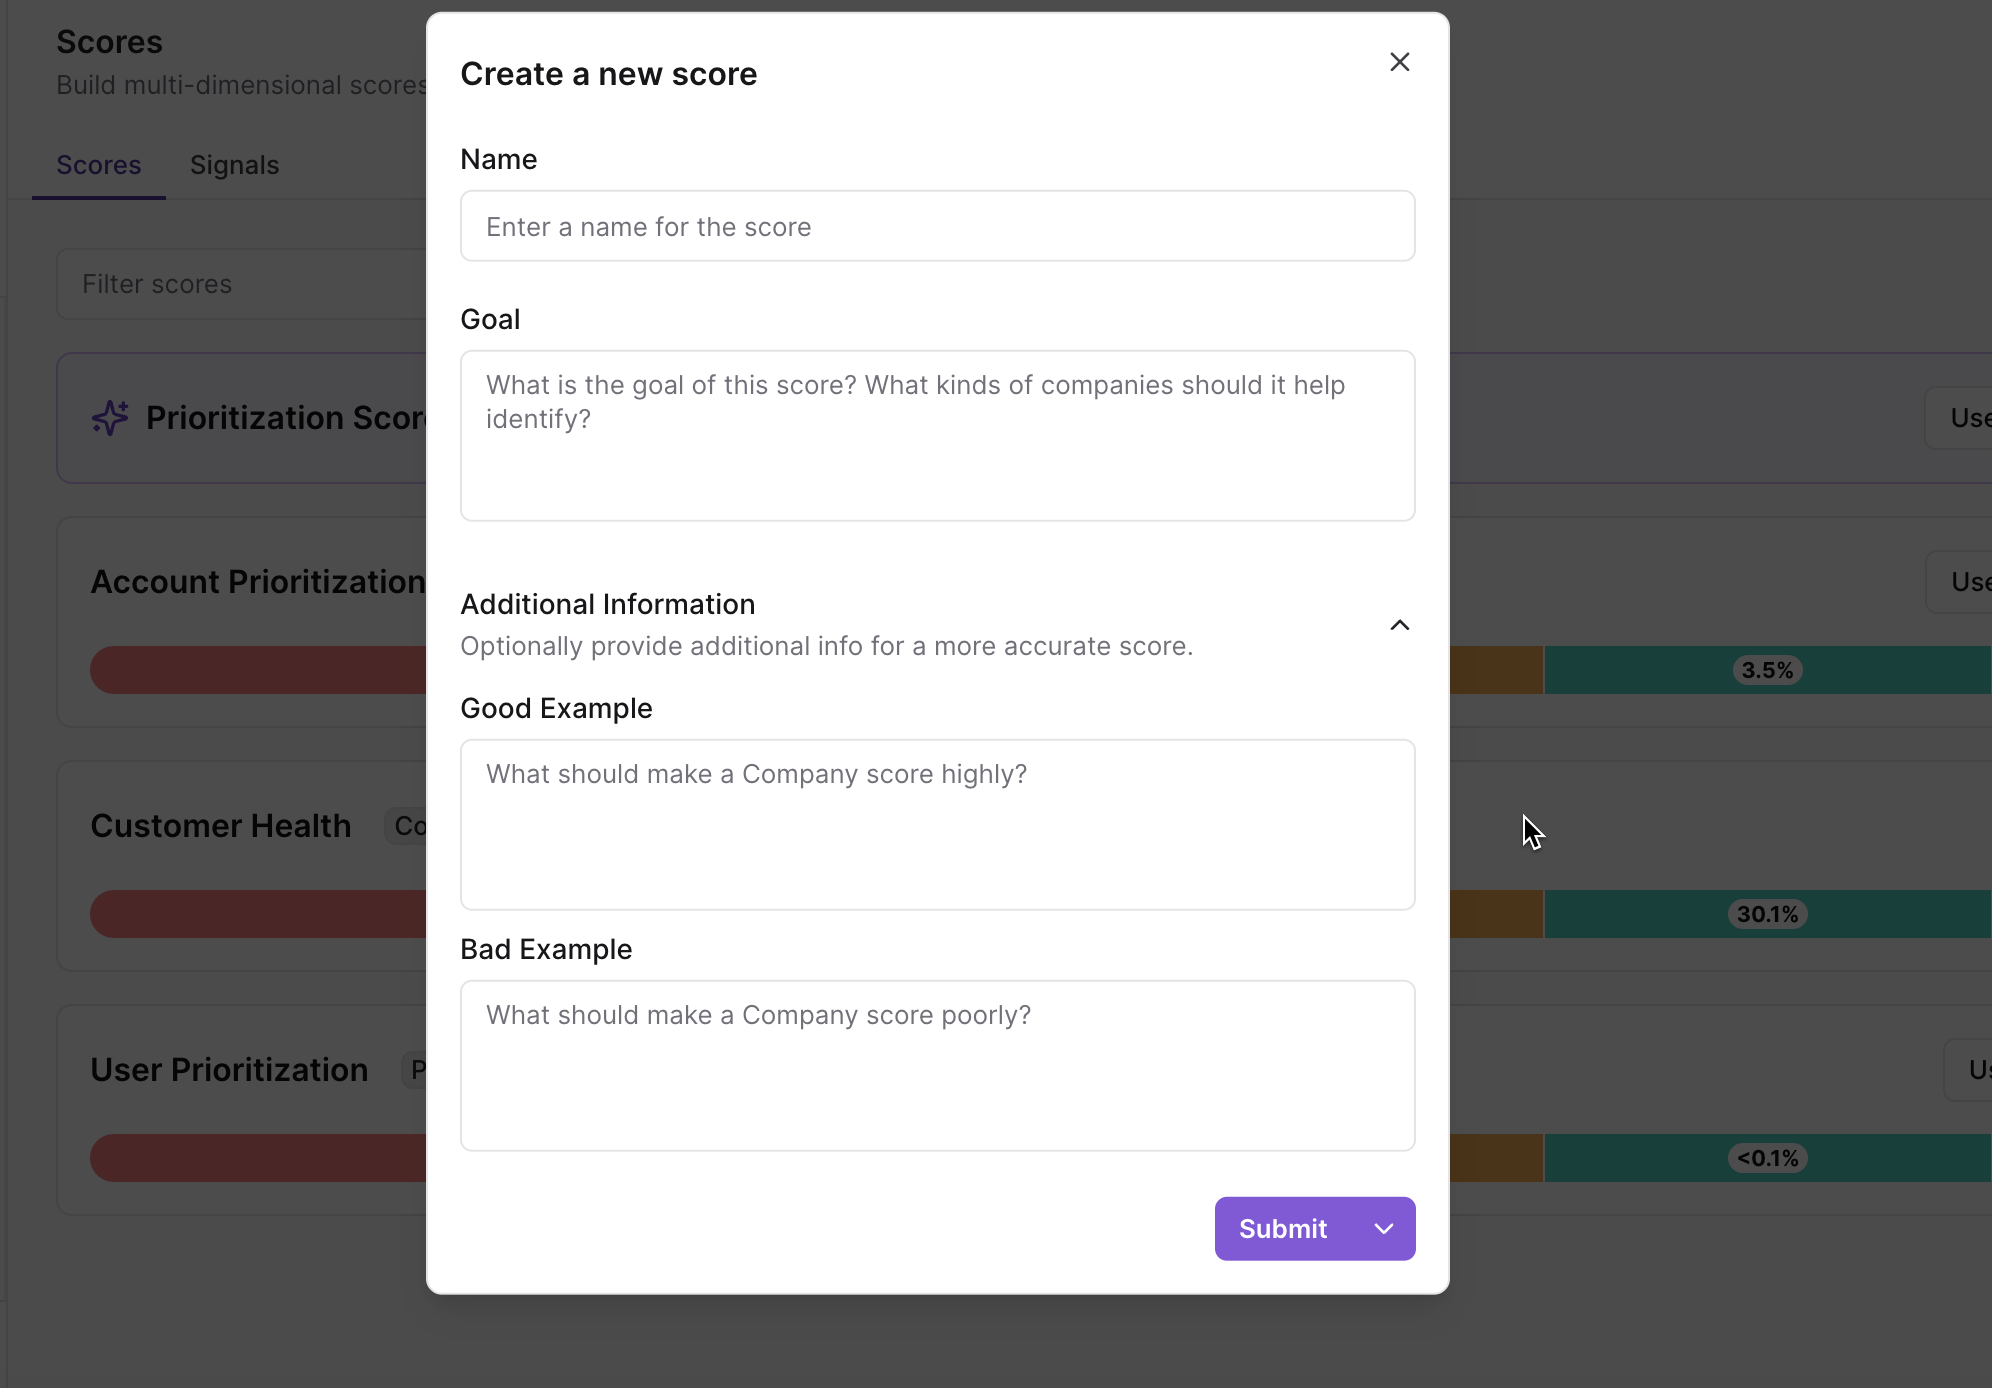
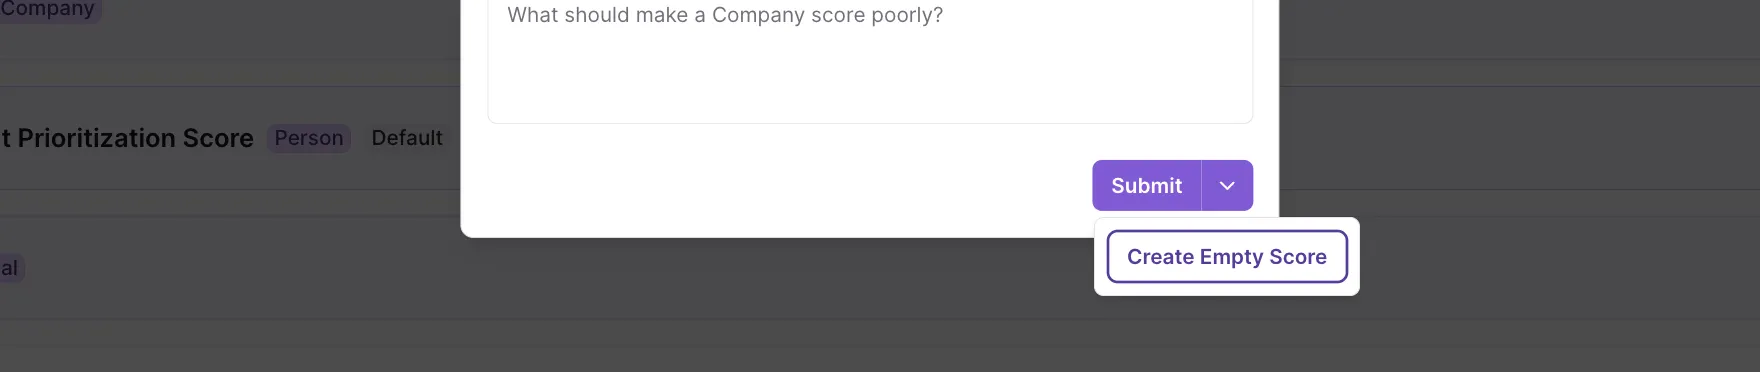
Prefer to start from scratch? Use the down arrow next to Submit and choose Create Empty Score. This will skip the AI-generated score configuration.
2. Selecting and adjusting inputs
When you create a new score, our AI will automatically include and weight inputs that it determines to be most relevant. Scores are built from inputs such as:
- Signals (e.g., Power User, Job Switcher)
- Traits (both User Defined Traits as well as Standard Traits. e.g. Industry, Role, Usage Level)
- AI Feed Events (Company Objects only)
You can further refine these to customize your score:
-
Add/Remove Inputs: you can add or remove inputs to adjust the score configuration.
To add new inputs, select "Add an Input" and pick from all the traits, signals, and events available in the workspace.
To remove an input, hover over the input, click the pencil item in the top right corner, and then select "Remove."
-
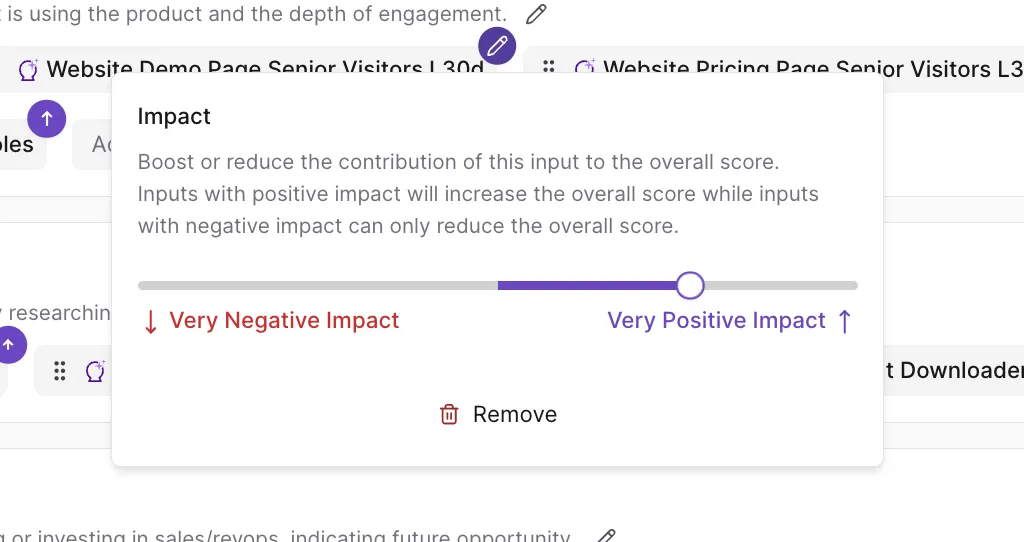
Weight Inputs: You can assign weights to each input—positive or negative—to reflect their importance.
Inputs can be assigned a weight by hovering, selecting the pencil, and using the slider. The higher the weight the more impact the input will have on the score. Negative weights are also supported to reduce the score given the presence of an input.
For a more in depth look at how these weights contribute to the score, visit our deep-dive documentation on score calculation.
-
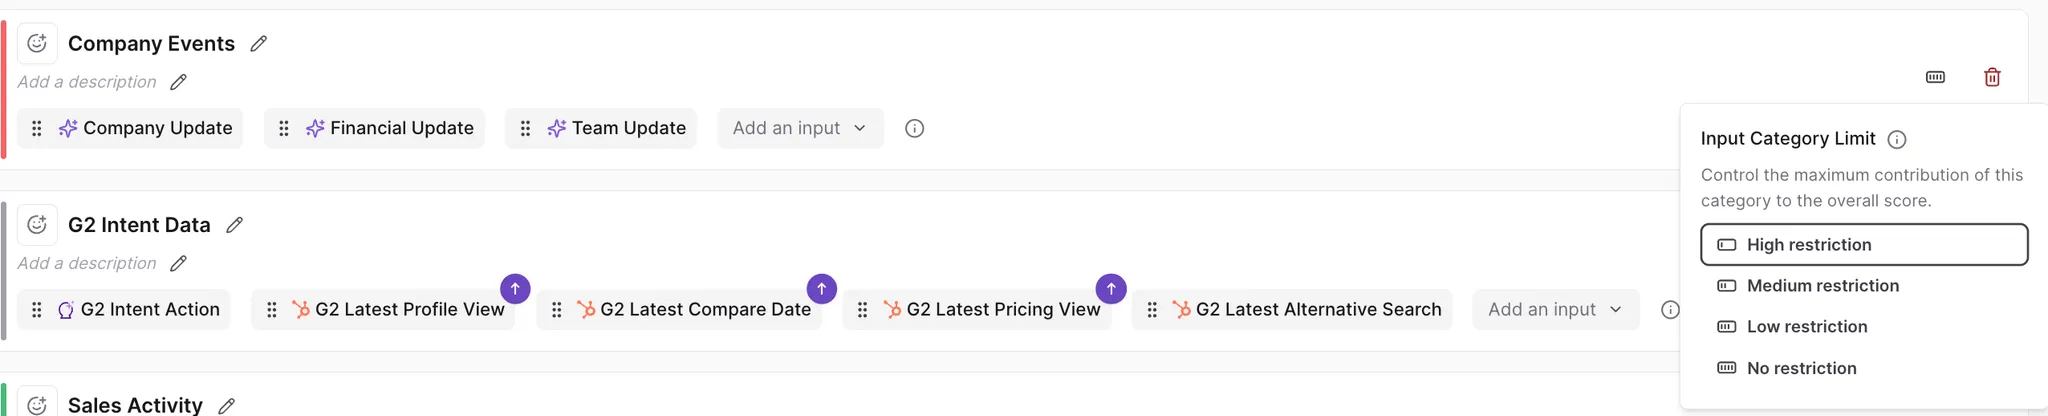
Group Inputs: Group your inputs into categories to keep things organized and make explanations more intuitive for reps.
Inputs must belong to a category, but can be dragged and dropped between categories. These categories are primarily used to help organize the score when presenting results in our Score Explainer. The categories are also equipped with a cap mechanism that prevents inputs from a given category from overwhelming the score.
-
Limit Input Influence You can set caps (restrictions) to prevent one category from overpowering the score.
To configure the cap, click the grey rectangle on the far right of the category. Choose a restriction level to designate how much the input can contribute to the score.
High restriction = the amount that category can contribute will be the lowest of all the options. Its contribution is restricted the most.
Low restriction = the contribution amount of the category is only slightly lessened.
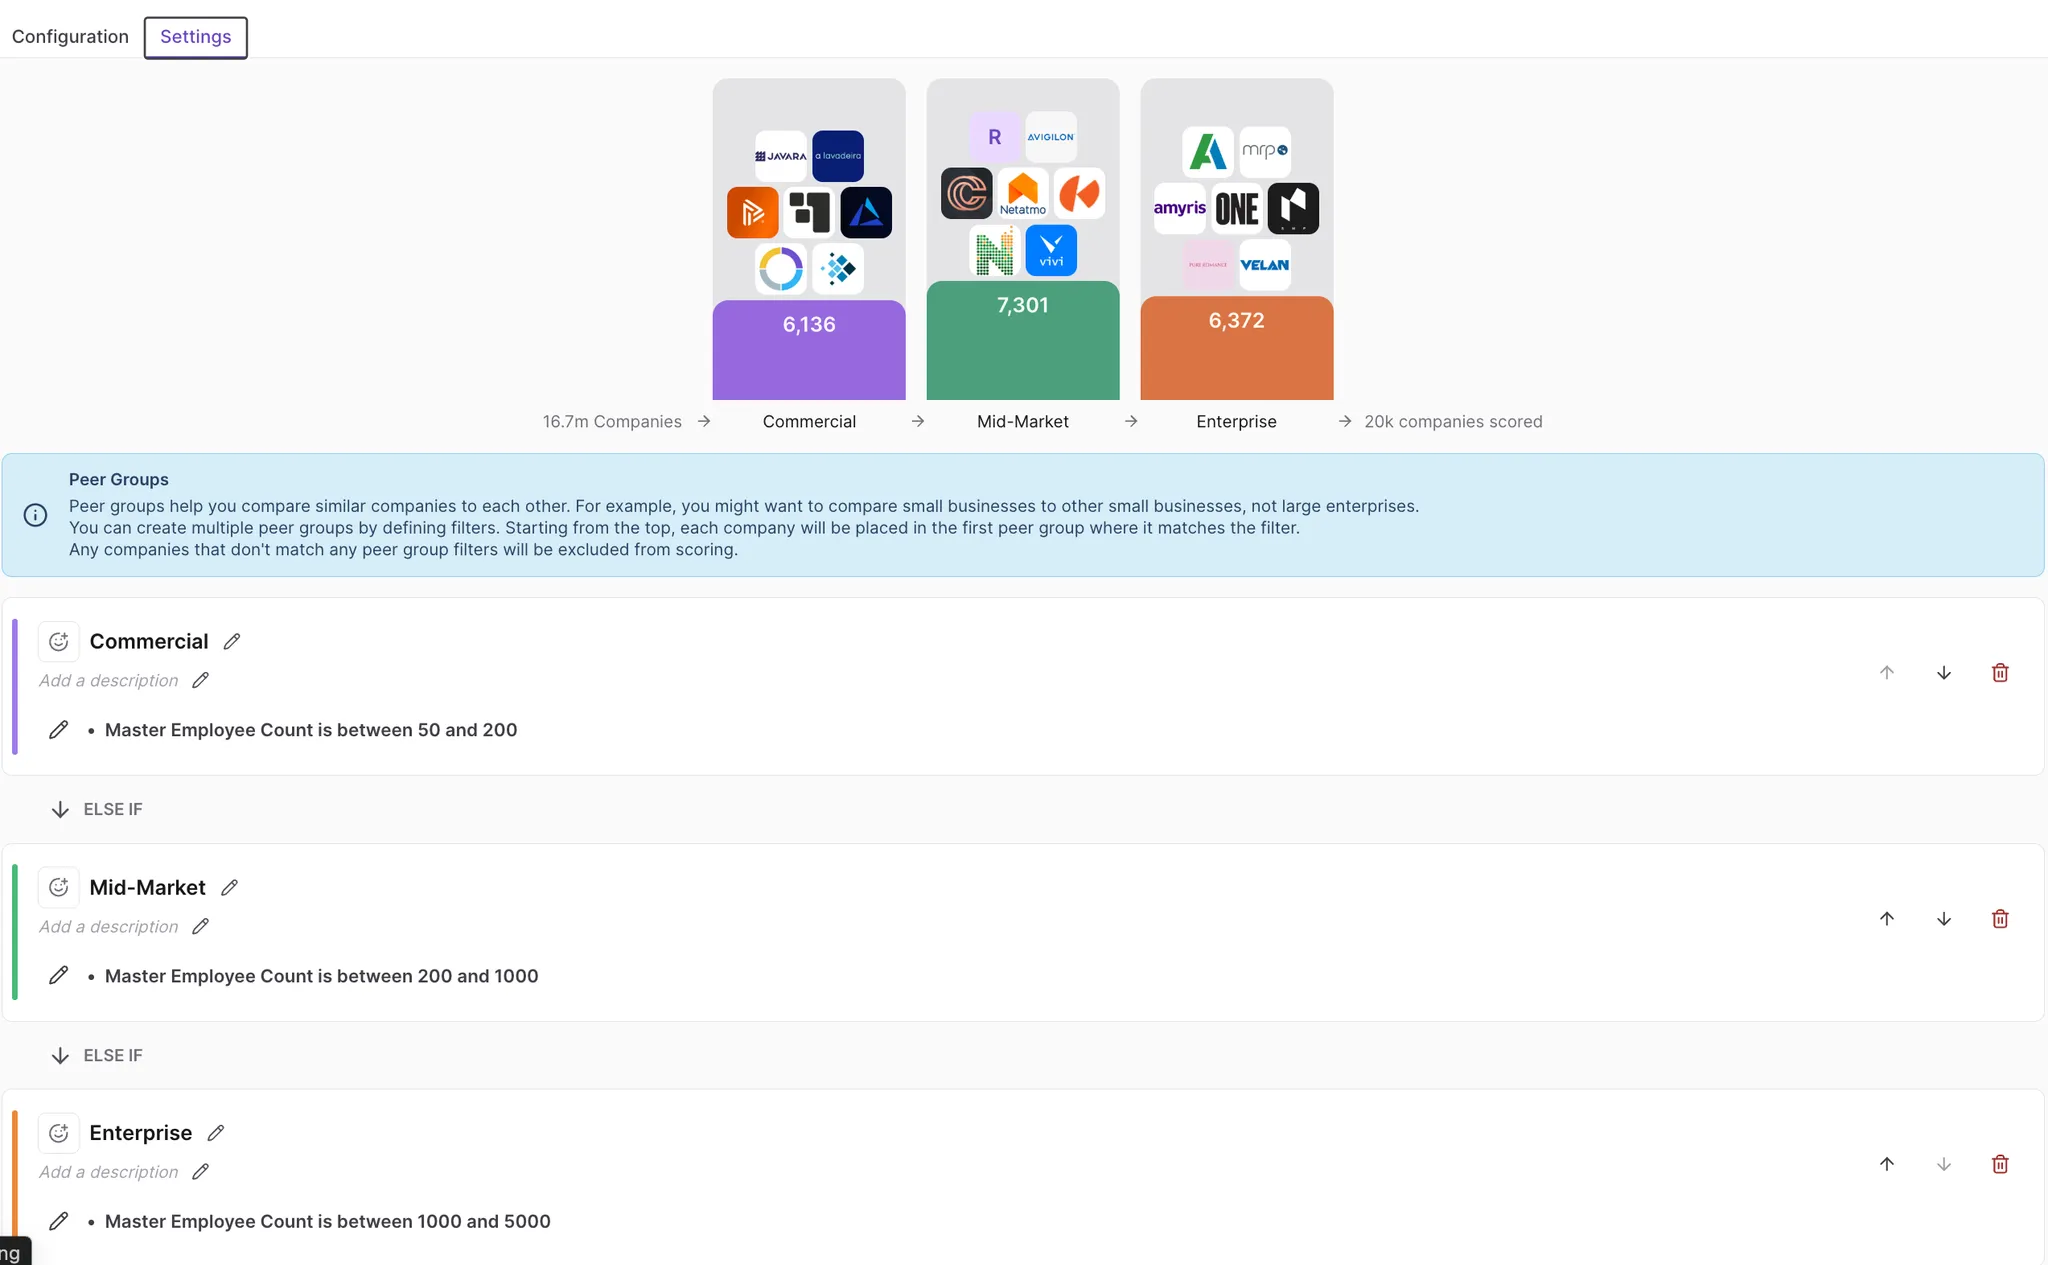
4. Configuring peer groups
Peer groups allow for more balanced and meaningful scores by comparing similar records (e.g., small businesses or large enterprises). Each score needs at least one peer group, and up to six are supported.
Example: Group companies by employee size or industry, so usage metrics are compared among similar types.
Records that don’t match a peer group won’t be scored.
If multiple Peer Groups are configured, company will fall into the first peer group it qualifies for.
6. Saving your score
Once the score is configured, click Save. Your score will immediately be available across the workspace and recalculated in real time whenever inputs change.
7. Configure the Default Score
You will need to set a default score for the object (i.e. if you are creating scores for the Account object, you will need to choose a score to be the default score for the Account object.) This will only need to be done once per object that you are creating scores for.
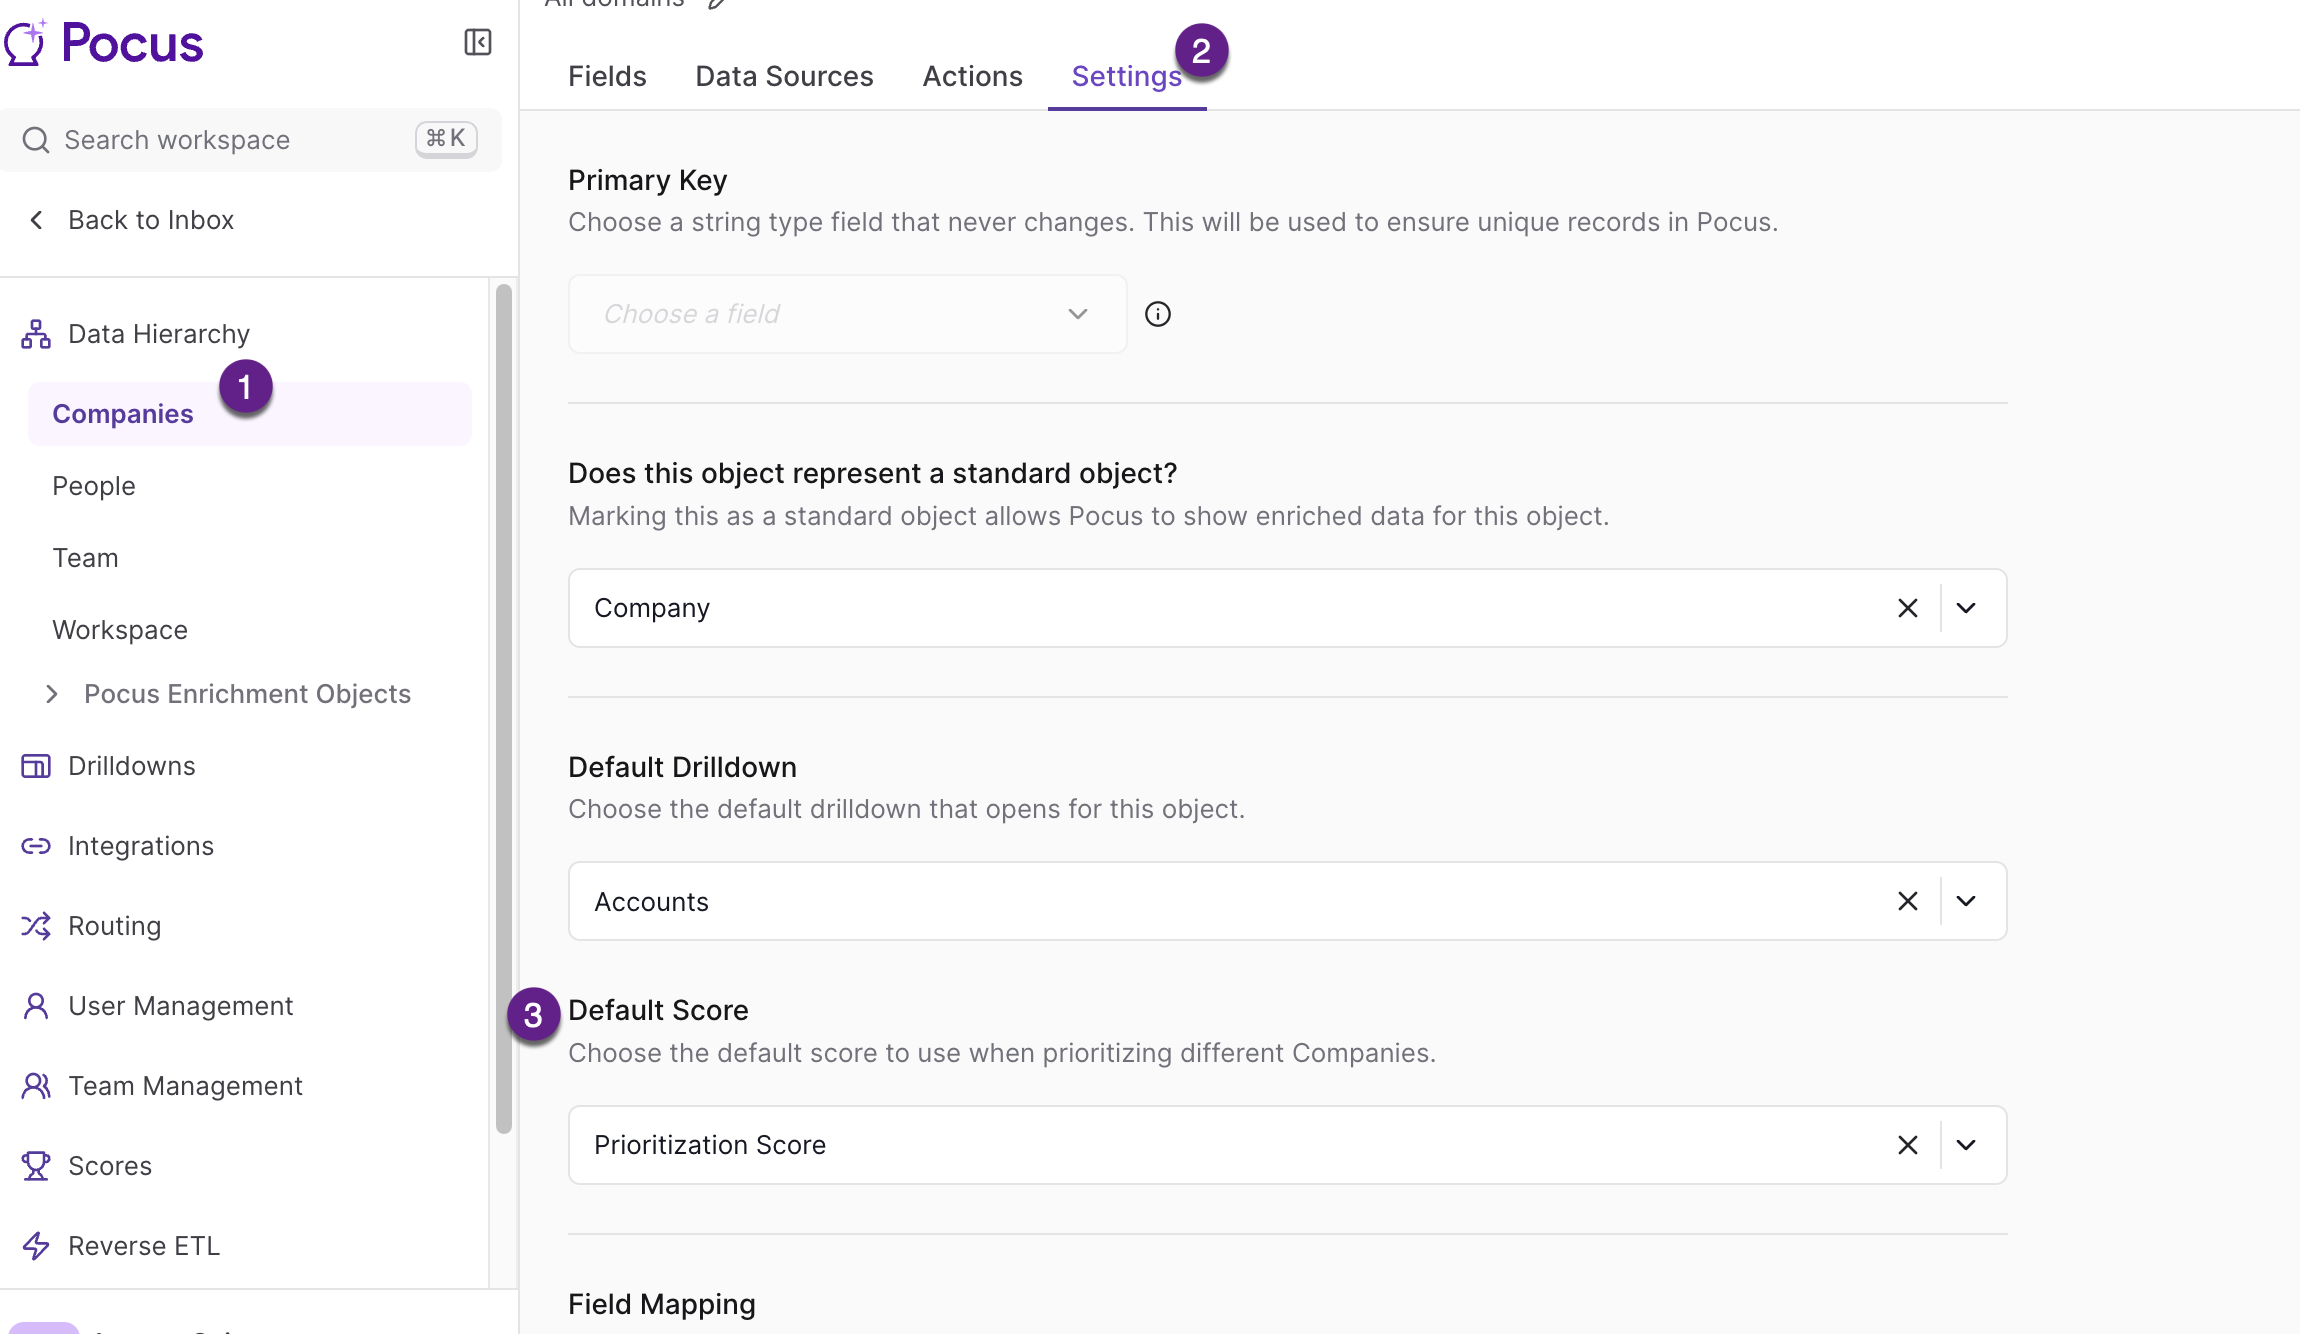
To set the default score:
Note: You will need the Full Editor or Admin role in order to make these changes. If you do not have access, please reach out to your Pocus admin to make the changes!
-
Go to Workspace Settings and select the desired object (example, Account or Company object)
-
Go to the Settings tab on the object
-
Locate the Default Score section and choose the desired score from the drop down menu. Click Save at the bottom of the page to save the changes.
👀 Viewing & Using Scores
Where To Use Scores
Scores can be used just like any other field in Pocus. This includes:
-
Lists and Tables: Add scores as columns
-
Drilldowns: See score info alongside key data
-
Filters: Use logic like “Score is A+”. You can also filter on the score’s surging state. ie. “Show all Companies where Intent Score is surging”.
Note: Score filters cannot currently be used as part of an associated object filter. ie. “Show People where the associated Company has an Intent Score of A+”
Additionally, you may designate one score as the “default” score for an object. The default score is used for prioritization when no other user input or preference has been provided.
Viewing Scores
Pocus helps you understand a record’s score through two main views: the score itself (Score Value) and a detailed breakdown of how that score was calculated (Score Explainer).
Score Values
Score values show the letter grade assigned to a particular record (ie. Company or Person), plus some related information.
There are three possible variants of the Score Value UI:
-
Score with history
“Score with history” is the most complete variant and includes:
-
Current Letter Grade:
The record’s letter grade is shown in the top-left corner.
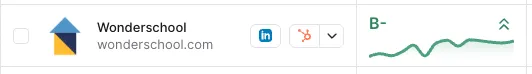
-
Weekly Change Indicators (surging ↑↑ or declining ↓):
The record’s surging indicator is shown in the top-right corner. The surging indicator will show a different icon depending on how the score has changed over the previous week. If the score has risen, it will show a single up-chevron. For more drastic increases, like in the screenshot, a double-up-chevron will be shown. Similar rules apply when scores drop.
-
Sparkline Chart
The bottom half of the variant shows the score’s value over the trailing 2 weeks as a sparkline chart. The color scheme is correlated with the letter grade. “A+” is purple, “A” is blue, “B” is green, "C" is yellow, and so forth.
Note that the surging indicator may be hidden if the score’s value has not changed very much compared to the prior week.
-
-
Score without history
The “Score without history” variant has the same components as the “Score with history” variant, minus the sparkline chart and surging indicator.
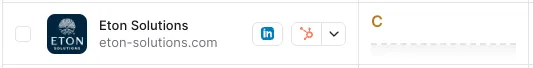
This variant is shown when the record has been scored, but Pocus does not have enough historical score data to render the chart. Pocus requires at least 8 days of historical data to display the sparkline chart.
-
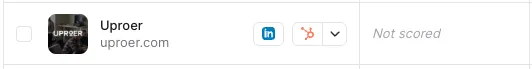
Not Scored
The “Not Scored” variant is shown when a record’s score has not been computed. This may happen if the record is not included in any of the score’s peer groups.
Score Explainers
Score Explainers provide additional details, such as Peer Group information, as well as explanations as to why the record was given a particular score
To access the AI Score Explainer, hover the mouse over a Score Value. (Note: The AI Score Explainer will not appear for records that are not scored.)
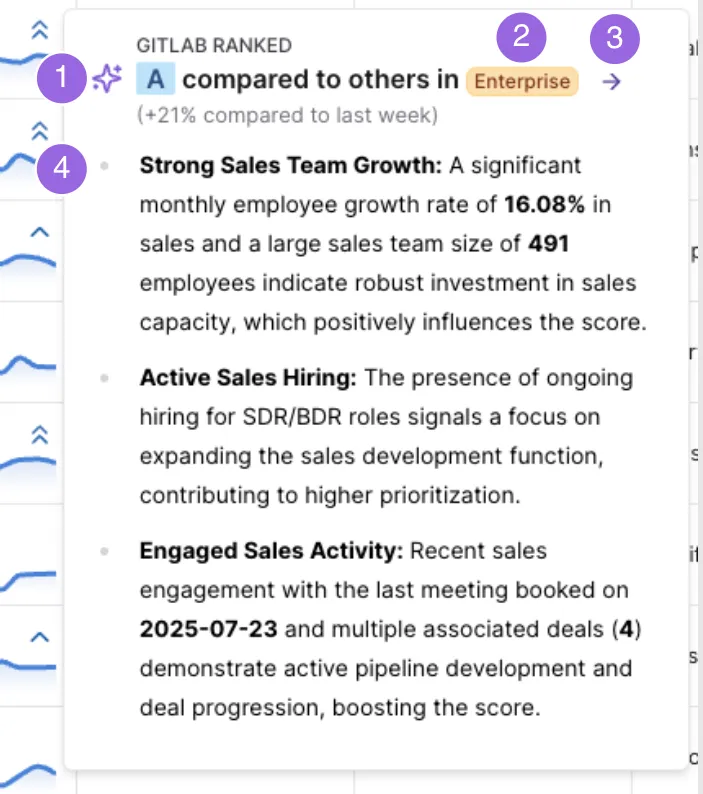
The AI Score Explainer is comprised of the following elements:
- The letter grade score assigned to the record. The score’s change compared to the previous week is listed below the letter grade. No change will be listed if the change was zero.
- The record’s peer group
- A right-arrow icon button. Clicking this button will open the Detailed Score Explainer
- Bullet Points - an AI-generated list explaining how the record’s strengths or weaknesses contributed to the score. The bullet points attempt to find themes and provide proof points by referencing specific values of fields which contributed to the record’s letter grade.
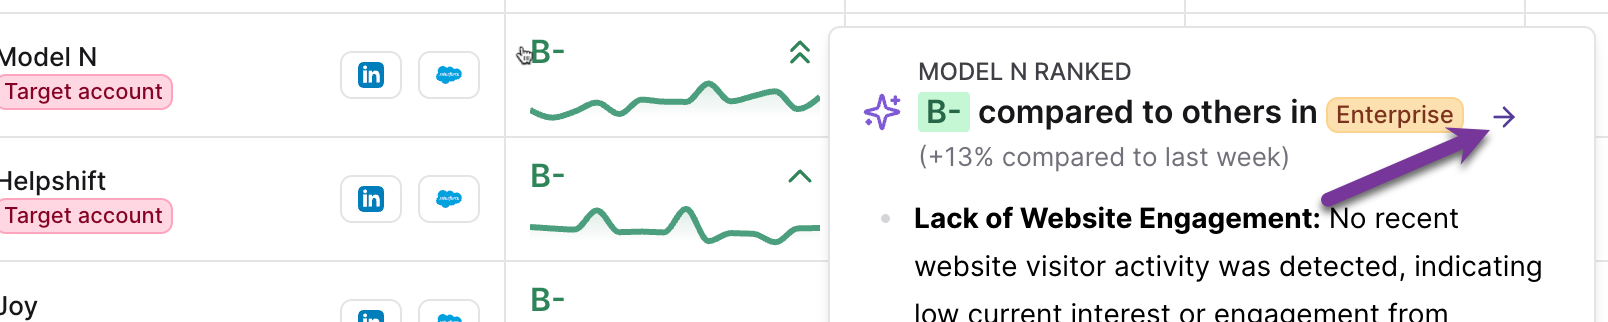
Detailed Score Explainer
The detailed score explainer exposes a breakdown of all numbers and values that fed the score calculation. To access the Detailed Score Explainer, select the purple arrow in the upper right of the Score Explainer.
You will then be presented with a comprehensive summary of the score.
The Detailed Score Explainer includes the following:
-
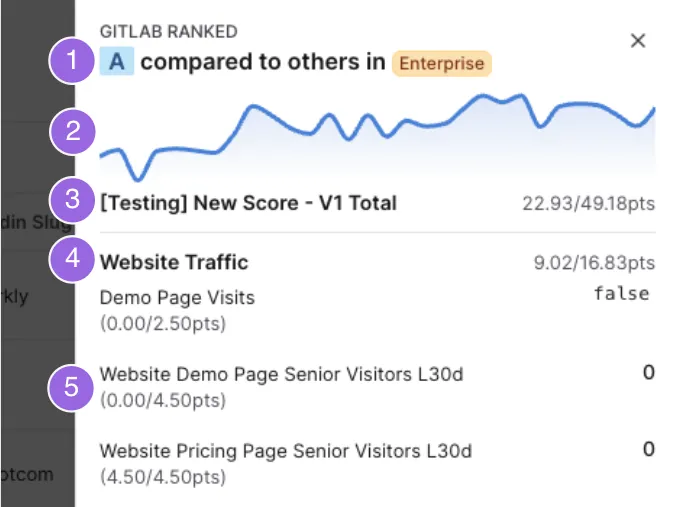
Headline - this is the same headline element as seen in the AI Score Explainer, including the score and peer group.
-
Score History Chart - An interactive chart showing the score’s numeric value over the last 30 days.
-
Total Score Calculation - Next to the score's name, the record's score will be shown as a fraction. The record's earned points will make up the numerator, and the total possible points will be shown in the denominator.
-
Category Score Calculation - Below the Total Score Calculation is a breakdown for each of the score’s input categories. Similar to the Total Score Calculation, the category’s name, and the points earned are shown.
-
Input Score Contribution - Beneath each Category Breakdown, a list of all inputs will be presented. Each input is listed by name. Below the input’s name is the input’s score contribution represented as a fraction with the earned points in the numerator and the maximum possible points in the denominator.
The value on the right-hand side is the actual value of this input.
The following operations are not currently permitted
- If a list has more than 1 million rows, you will not be able to sort by score
- Unable to score lists containing third party (3P) people
If these operations are attempted, an alert will be presented along with suggested alternatives.