Playbook Performance Reporting
Get insight into how well your Pocus Playbooks are performing with reporting.
What is Playbook Reporting?
With Pocus reporting, you can see how well the Playbooks you’ve built are driving conversions towards the outlined goals. Goal performance reporting gives you a view into how surfaced leads convert compared to those non-surfaced, as well as the ability to compare the conversion rates of your different playbooks — learn which approaches are the most effective. Timeline and individual playbook reporting give you a deeper view into the records that were surfaced, actioned, and ultimately converted from a given playbook.
Performance
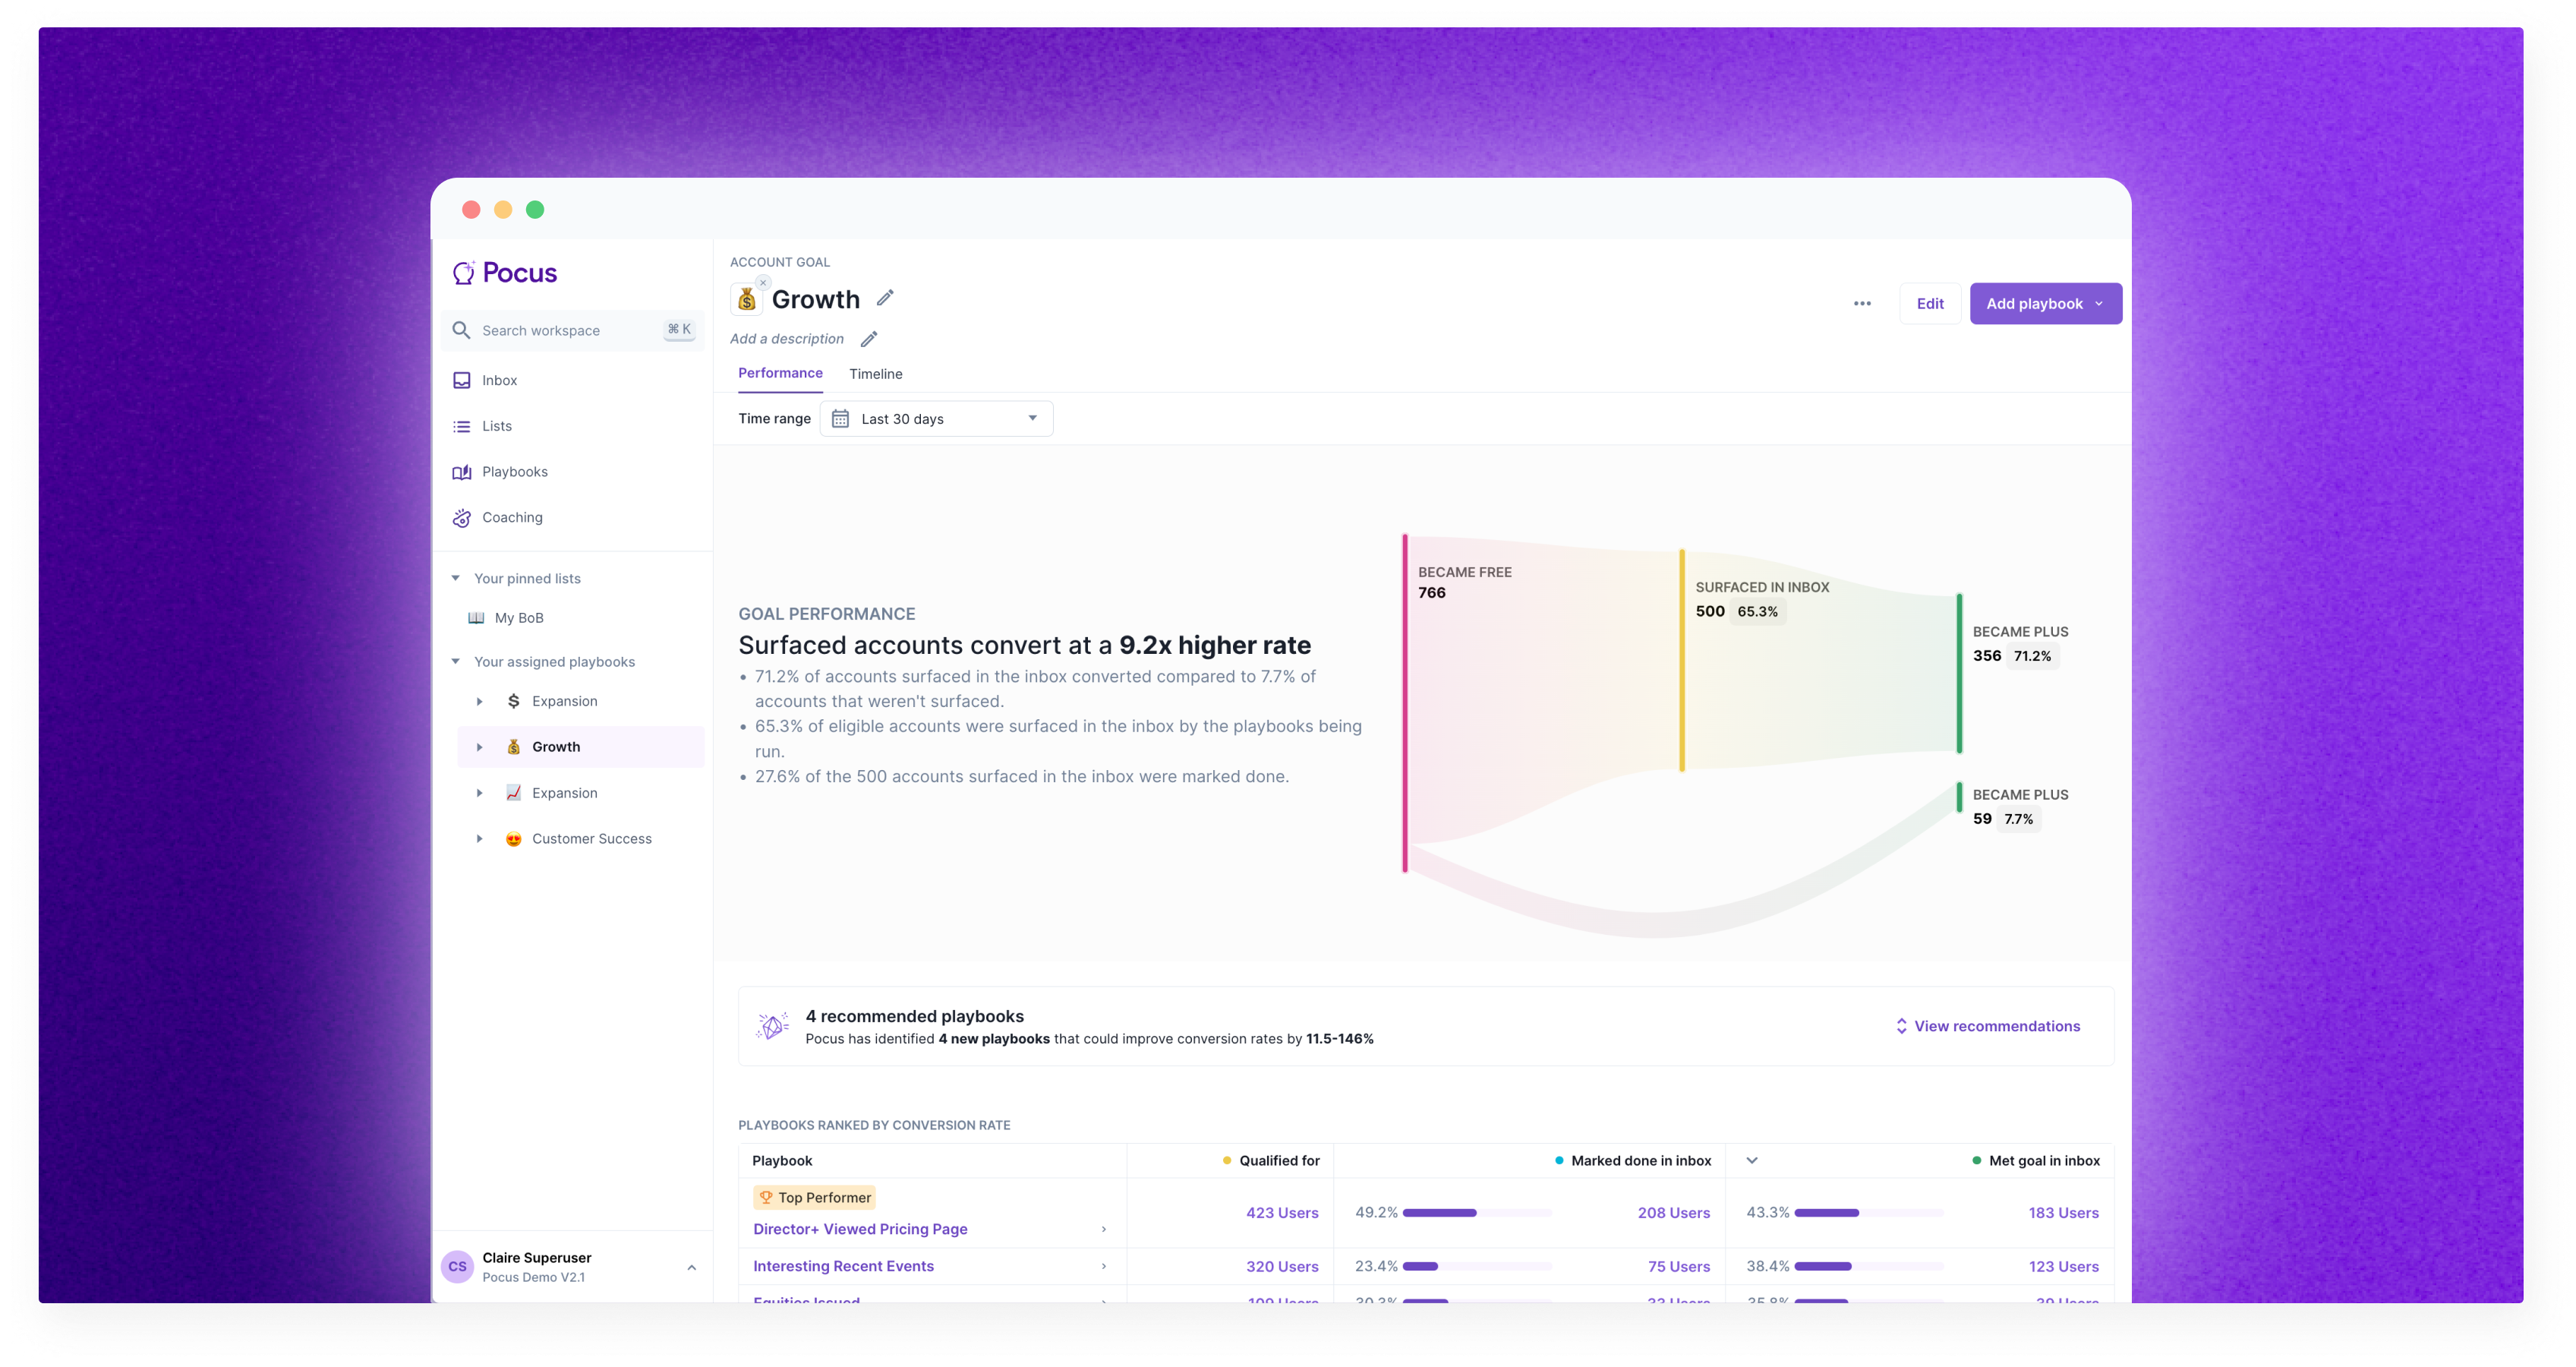
When you navigate to any goal in Pocus either from your sidebar or Playbook directory page, you'll land on the Performance tab. Here you'll get a deep dive into the conversions Pocus has seen towards that goal. You'll also be able to compare how the different Playbooks you're running are performing. Let's dive into the data behind each section.
Goal Performance
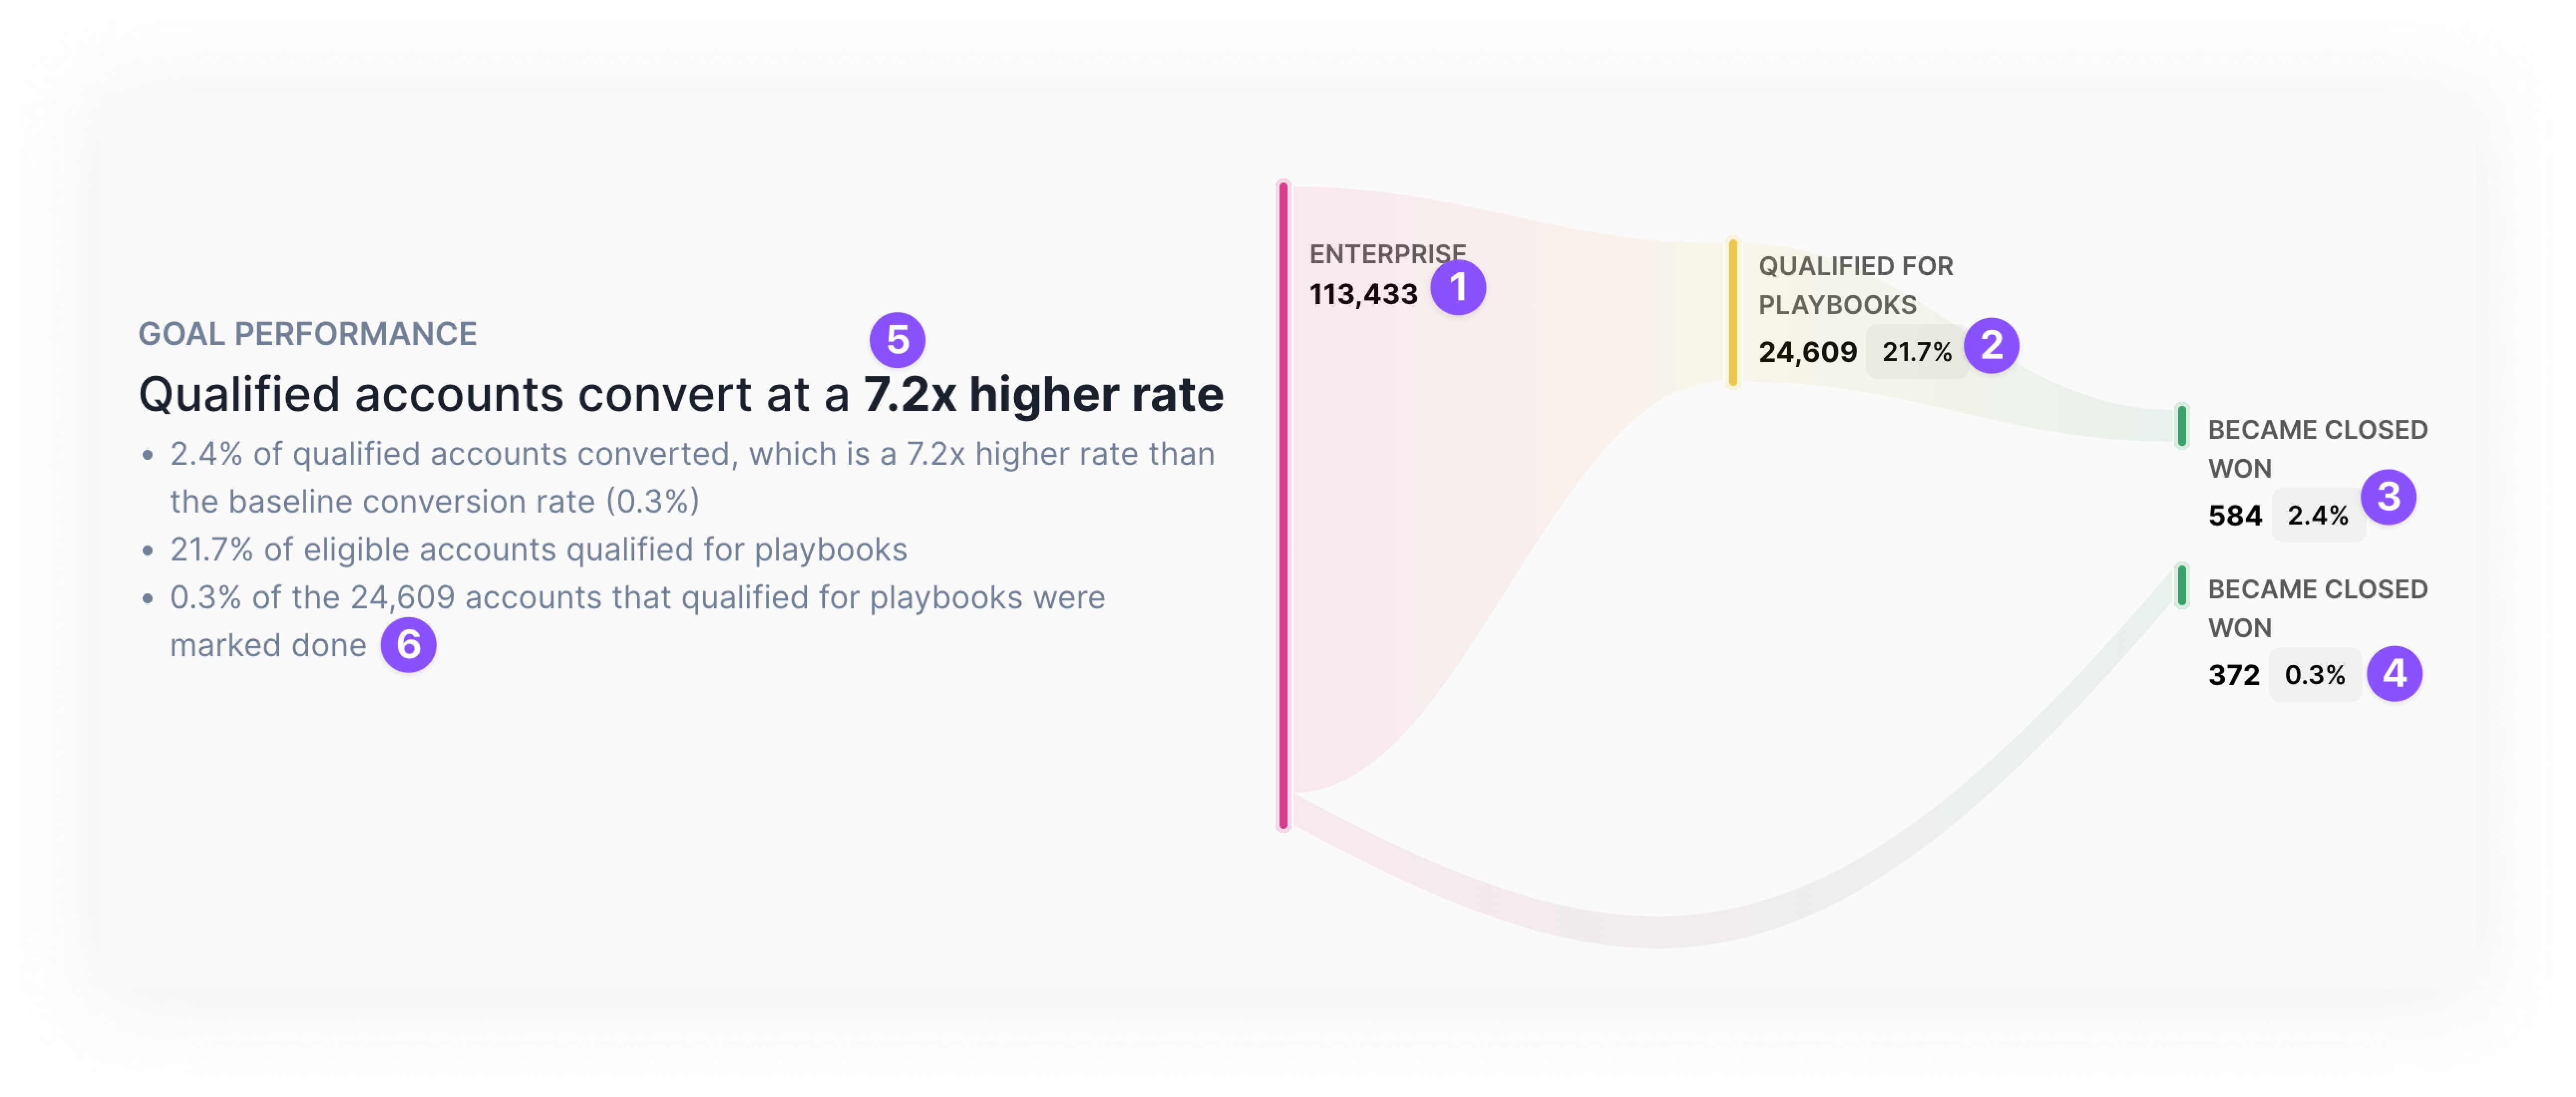
The goal performance sankey shows how records that have surfaced in playbooks convert compared to those not surfaced.
1️⃣ In the above, we see that 113,433 accounts were eligible for this goal in the time period selected.
2️⃣ Of those 113,433 accounts, 24,609 (or 27.1%) were surfaced in a playbook during that time period. This means that either the account was surfaced directly, or an object associated to the account was surfaced (e.g., a Director user on that account was surfaced).
3️⃣ Of those 24,609 surfaced accounts, 584 went on to have a Closed Won opportunity after having been surfaced. That is 2.4% (or 584 / 24,609) of accounts.
4️⃣ 372 accounts out of the 113,433 eligible accounts (0.33%) became Closed Won without ever surfacing in a playbook.
5️⃣ That represents a 7.2x higher rate ( = 2.4% / 0.33%)
6️⃣ 0.3% or 73 accounts out of the 24,609 surfaced accounts were marked done during that time period
Click on any of the numbers in the visualization to pull up a specific list of records.
Cross objects goals & playbooksBecause playbooks and goals can be run on different objects, Pocus aggregates all of the stats to reflect the unique goal object (i.e., the Account object above). Easier to explain with examples!
**Setup:**You have a goal that is looking a converting Free Accounts to Paid Accounts. Accounts can have many users on them. In that goal, you are running a playbook to surface any Director+ user that signs up.
Example:
- The PiedPiper account is eligible because it is a free account. This will count as 1 eligible account towards the 1️⃣ number above.
- Richard, the CEO and Co-Founder, signs up and qualifies for the
Director+playbook. Jared, CFO, also signs up and qualifies for theDirector+playbook. Because they are both at the same account, this will show as only 1 account qualifying in playbooks (2️⃣ in the above sankey)
Ranked Playbook Performance
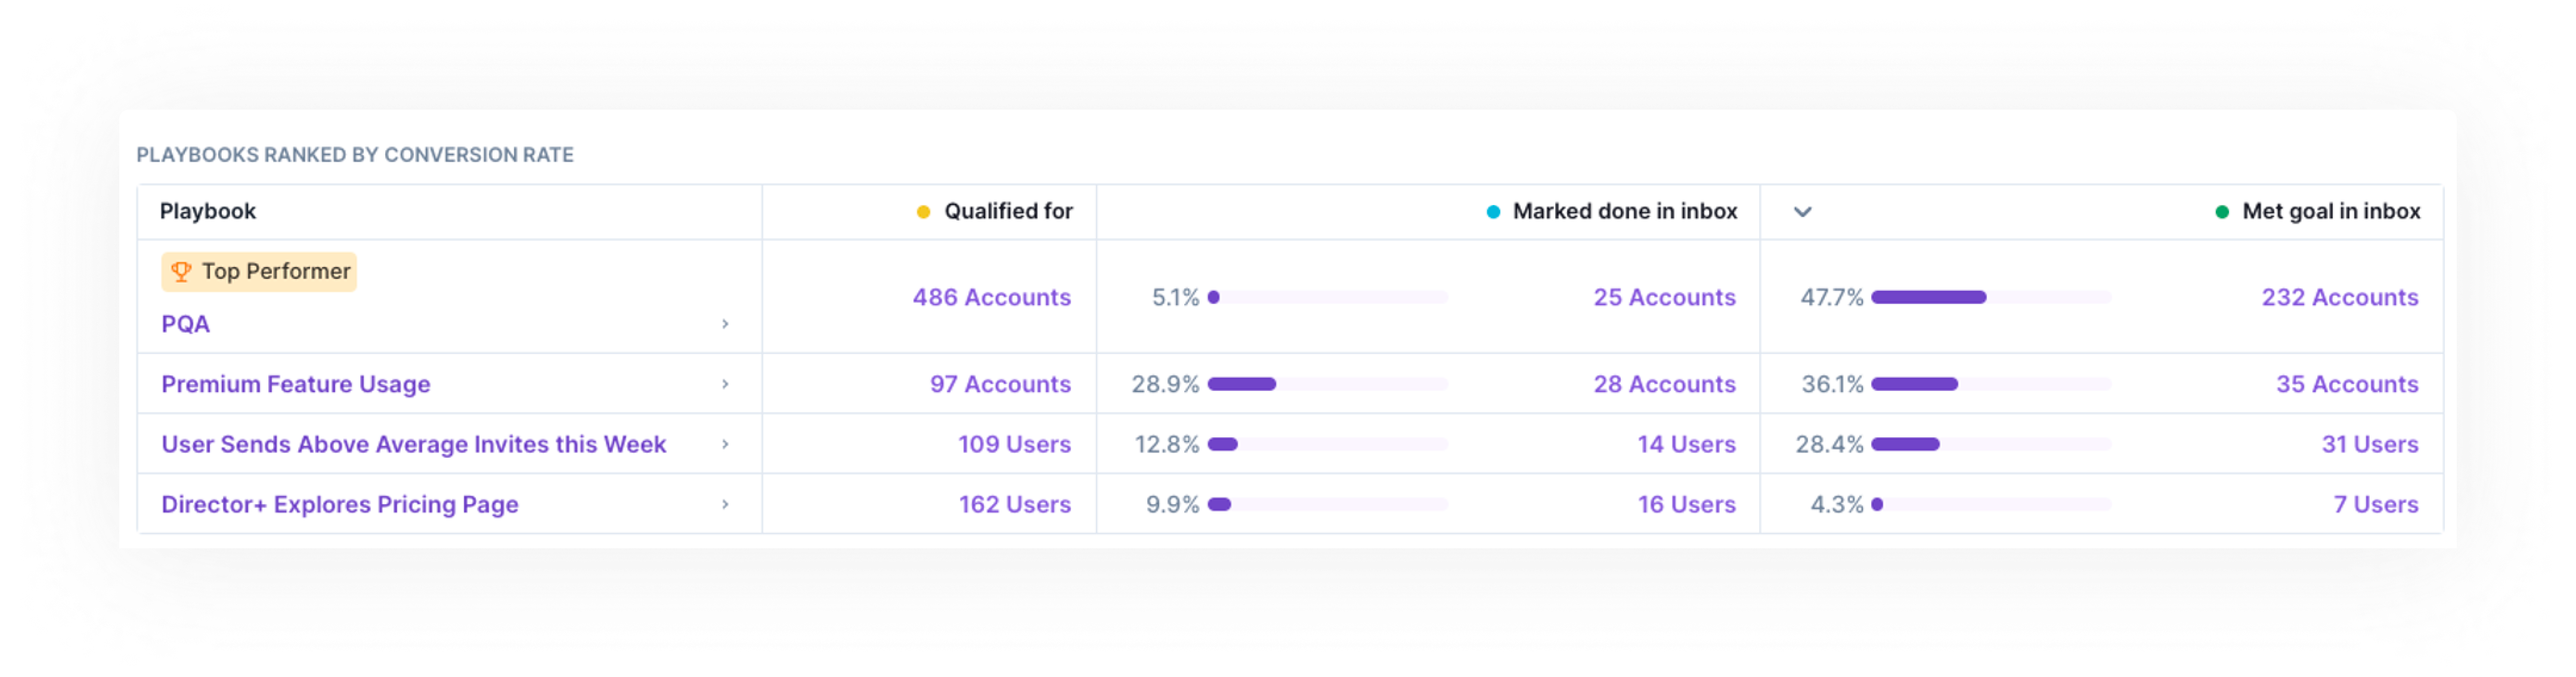
The ranked Playbook table is a great place to come for monthly audits of Playbook performance. There are three main things you can learn from this table:
- Top performers: Quickly see which Playbooks are driving the most conversions and which have the highest conversion rates by looking at the
Met goal in inboxcolumn. Use these insights to prune low performing playbooks and re-enable reps on top performing ones. The top performers are not always the fan favorites.- Note: This table is not a true funnel. It is not required that the required was marked done to count as met goal.
- Rep adoption: See which playbooks are being actioned the most by reps, by sorting by the
Marked donecolumn. This gives you an insight into how many records (and what percent of qualified records) were actioned by a rep.- Note: Pocus counts any click of Mark Done or any successful action that is set to Mark Done. Ensure your Playbooks are configured to maximize this data by readinghere.
- Lead volume: Balance high conversions with an appropriate lead volume by ensuring that the correct number of records are qualifying for each playbook. We recommend that no more than 200 leads per rep are surfaced in a given playbook per week. The timeline also gives a great view to assess lead volume daily.
Click into any number in the performance table to see which exact records qualified, were marked done, and/or converted.
Timeline
For a more granular view of what records have surfaced, been actioned, and ultimately met the goal click on the Timeline tab. The timeline can be viewed for the past 7, 30, or 90 days (1️⃣) with results grouped by day or week (2️⃣). In the below example, we are viewing all leads surfaced across all playbooks in the Free -> Paid goal by day for the last 30 days.
Each vertical bar here represents the total number of leads that were surfaced that day, across all playbooks. If you hover over a bar, you'll see a break down of those leads by what their current status (3️⃣). The example below shows that:
- On 2/3/23, 700 records were surfaced in the
Free -> Paidplaybooks - Since then...
- 200 have met the goal (e.g., are now Paid)
- 200 have been marked done but not met the goal
- The remaining 300 have neither met the goal nor been marked done.
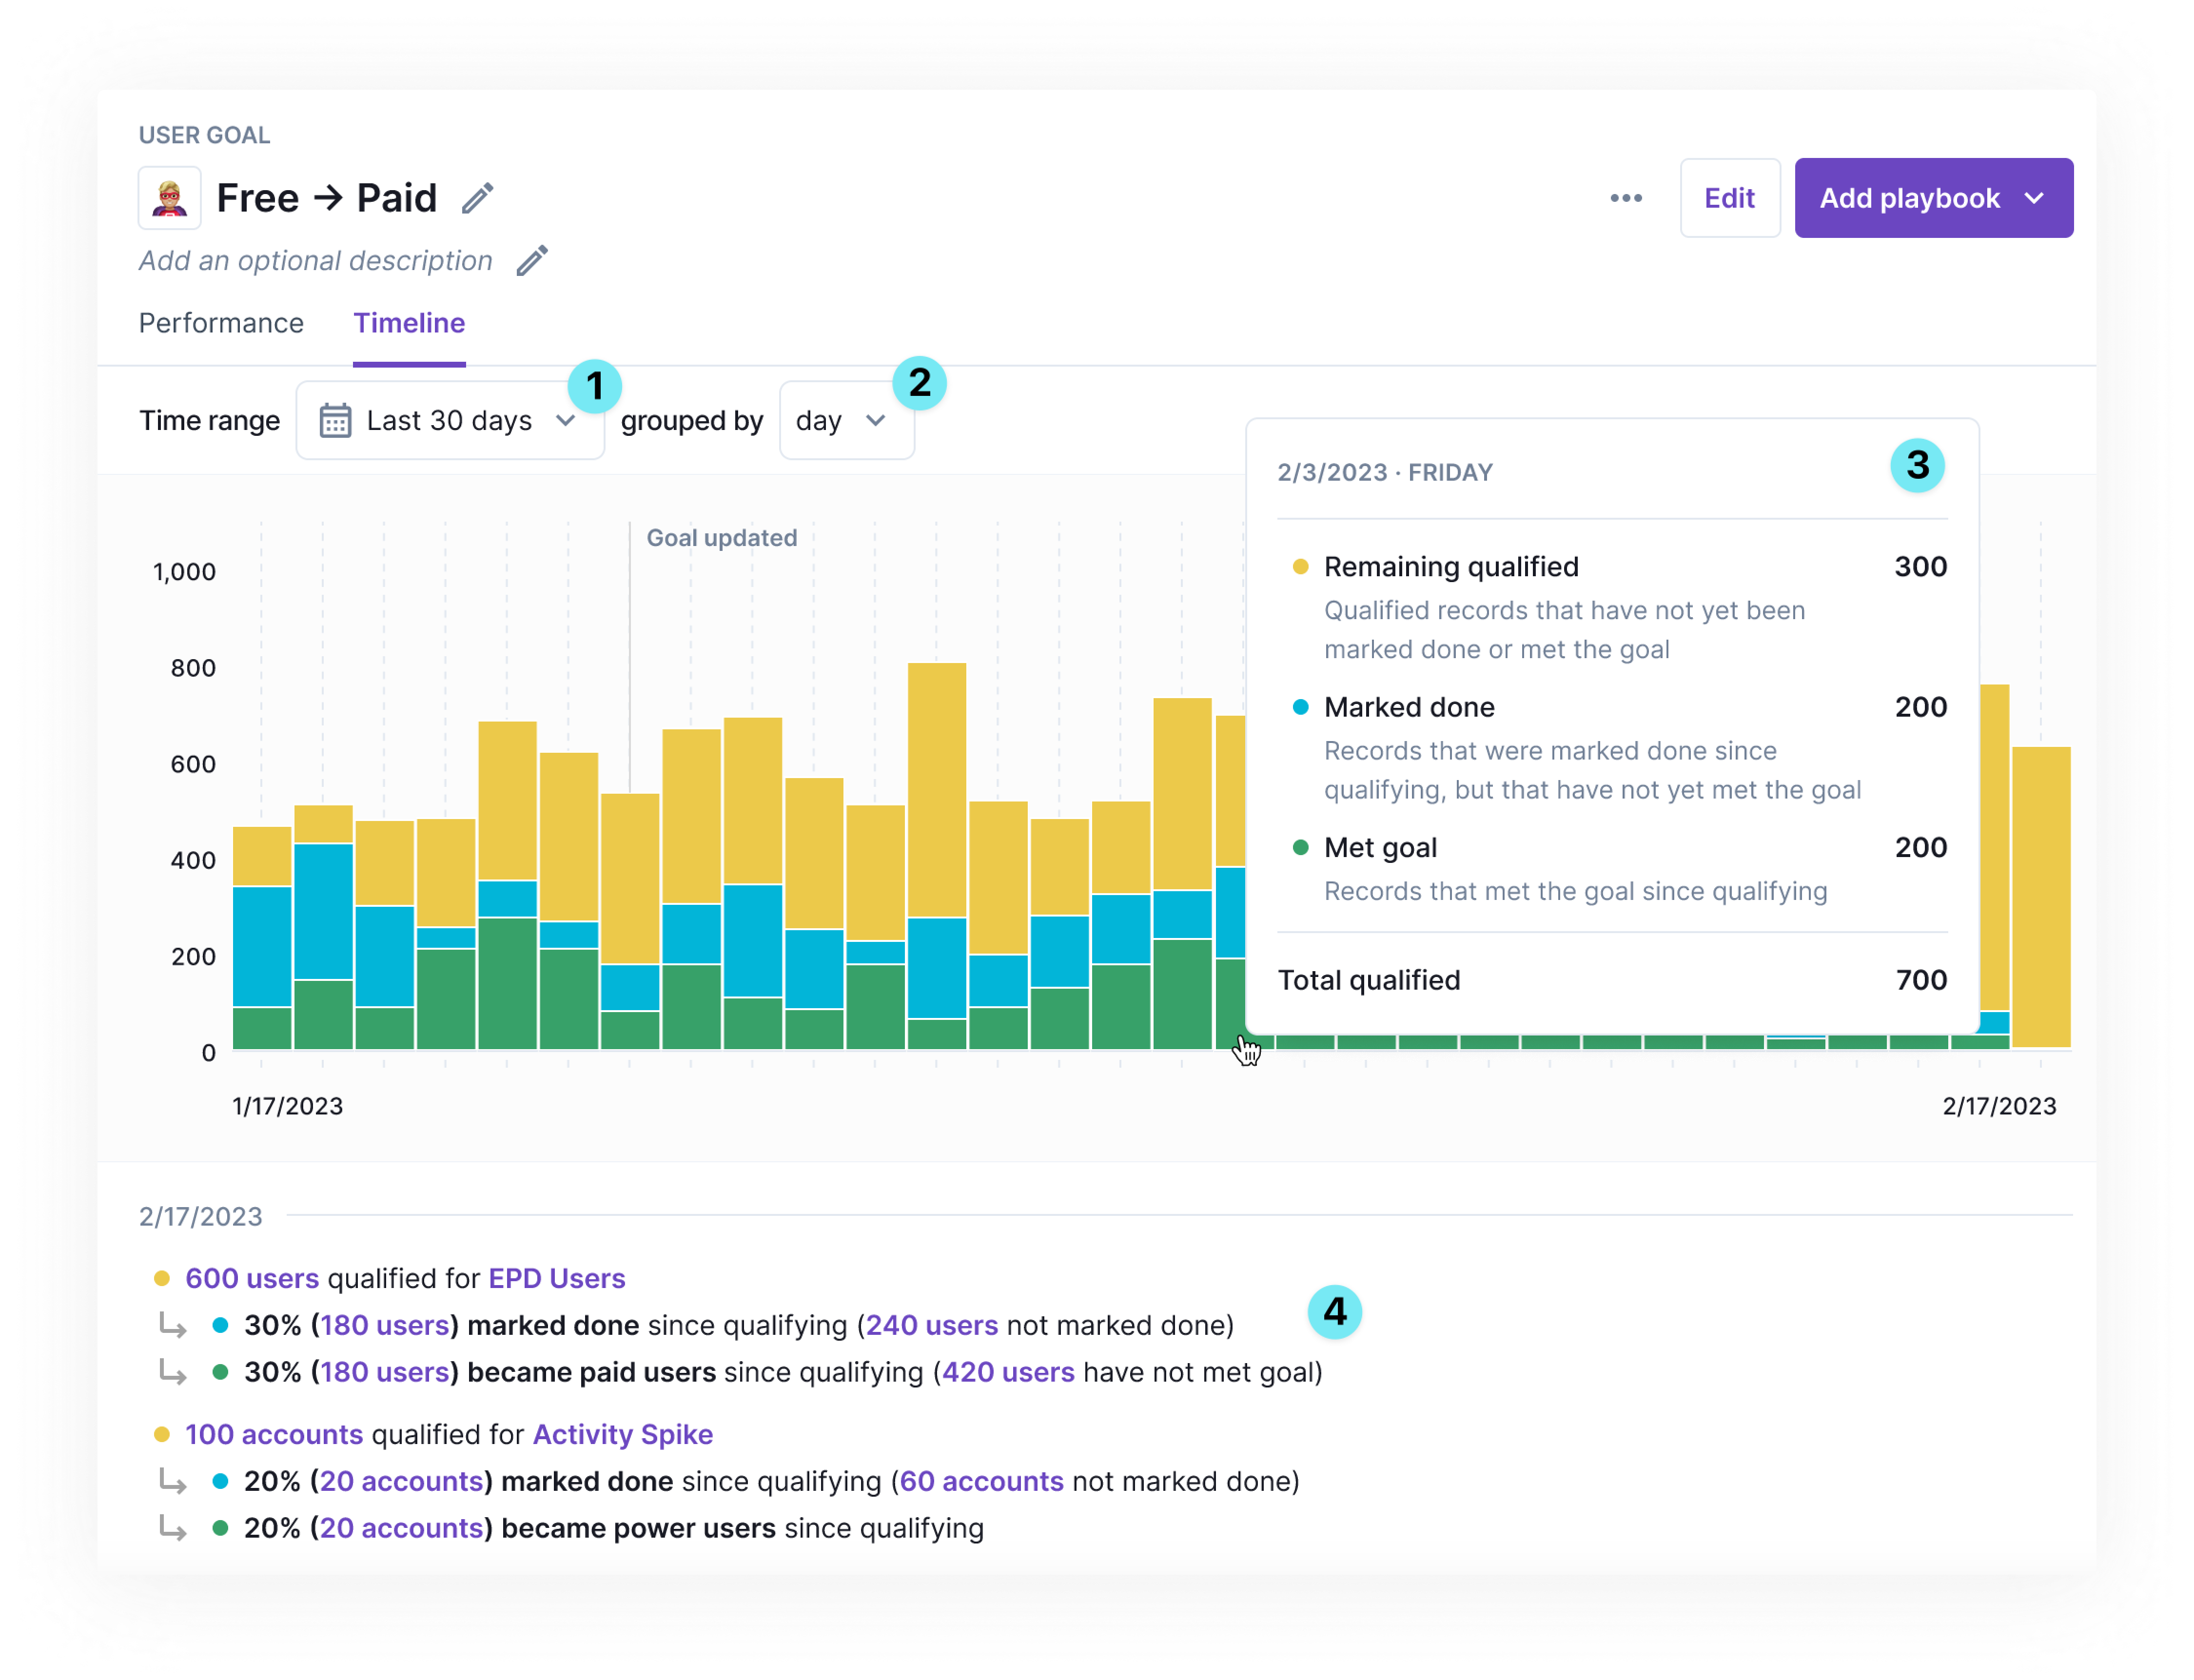
Below the bar graph is an in depth timeline (4️⃣) of all the records that qualified for a playbook, were marked done, and then converted. You can drill into any of the purple linked numbers to see a list of the records. This is a great resource for re-engagement and playbook QA.
Playbook Timeline
The timeline view is available both for Goals and individual playbooks. To navigate to a playbook timeline, click into the Playbook from the sidebar, listing page, or Goal timeline. Toggle to the Timeline tab. The data presented is the same as above just filtered for that specific timeline
If you are interested in more granular reporting, reach out to your support team about our data share and CRM sync best practices.