Playbook and Lists Usage Reporting
This report provides both high level and granular details on the configuration and activity within Goals, Playbooks, and Lists.
Available Filters
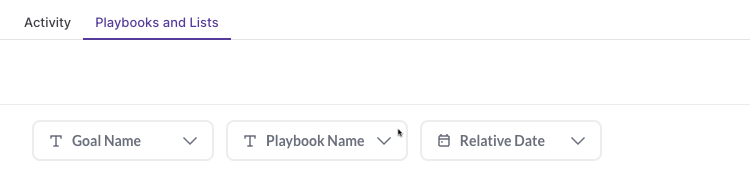
The Playbook and Lists report allows you to filter by Goal Name, Playbook Name, and Relative Date
Available Metrics for Playbooks and Goals
The following sections are available for Playbook and Goal usage reporting:
-
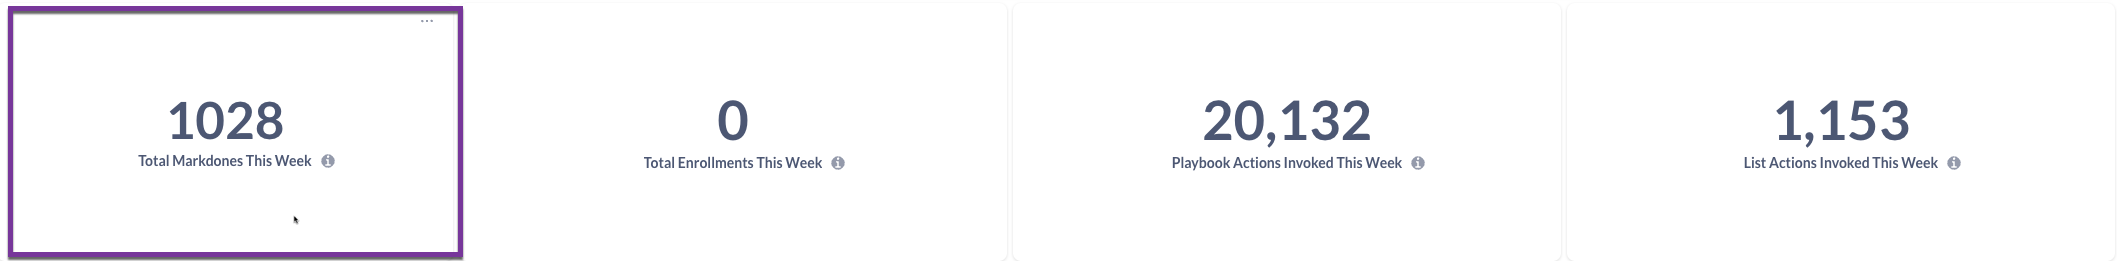
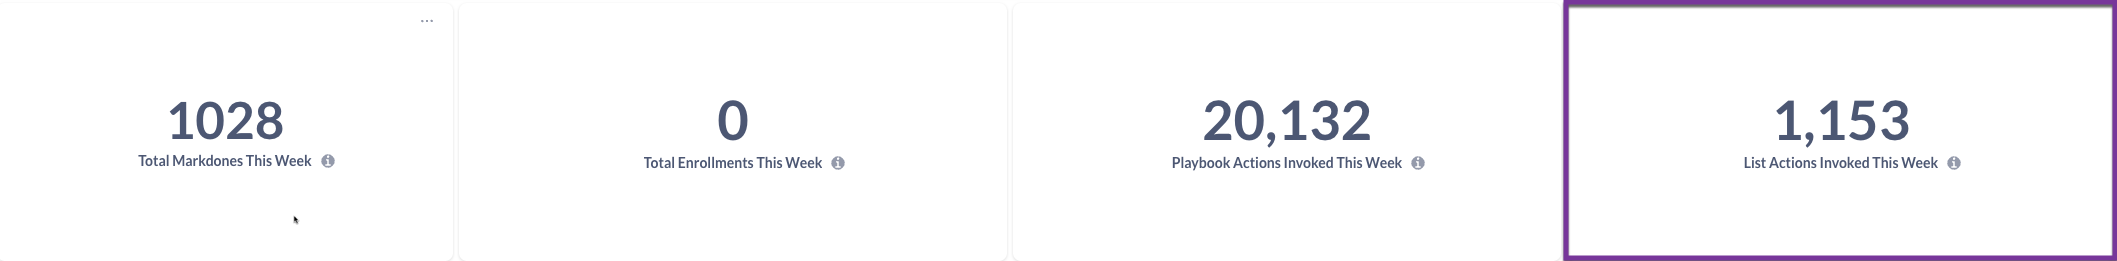
Total Markdones This Week: Total number of markdones invoked by users in Playbooks during the current calendar week starting Sunday
-
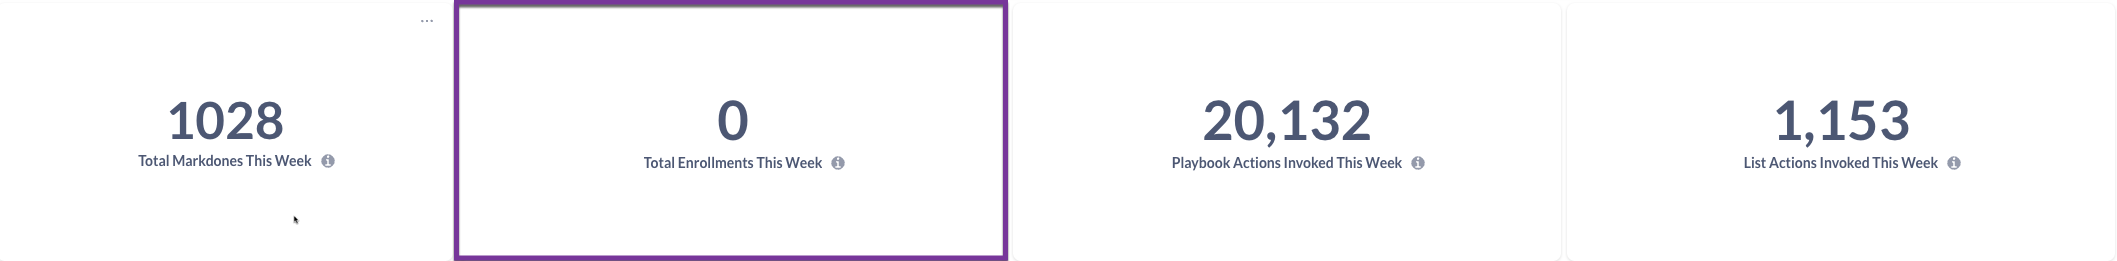
Total Enrollments This Week: Total number of enrollment actions invoked by users in all locations during the current calendar week starting Sunday
-
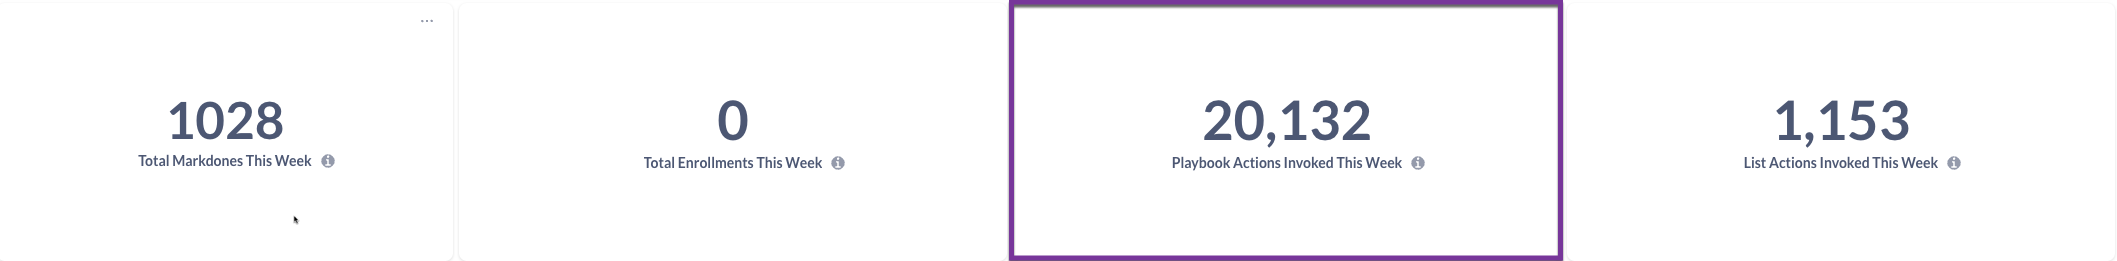
Playbook Actions Invoked This Week: Total number of actions (such as Enrollments, Open in LinkedIn, Snooze, etc) invoked by users in Playbooks during the current calendar week starting on Sunday
-
List Actions Invoked This Week: Total number of actions (such as Enrollments, Open in LinkedIn, Snooze, etc) invoked by users in Lists during the current calendar week starting on Sunday
-
Top 10 Most Active Playbooks This Week: The top 10 Playbooks with the most actions invoked for the current calendar week
-
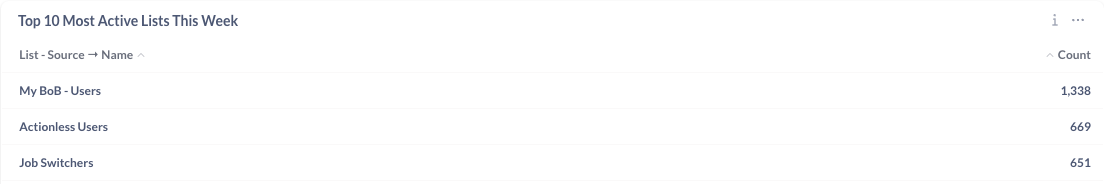
Top 10 Most Active Lists This Week: The top 10 Lists with the most actions invoked for the current calendar week
-
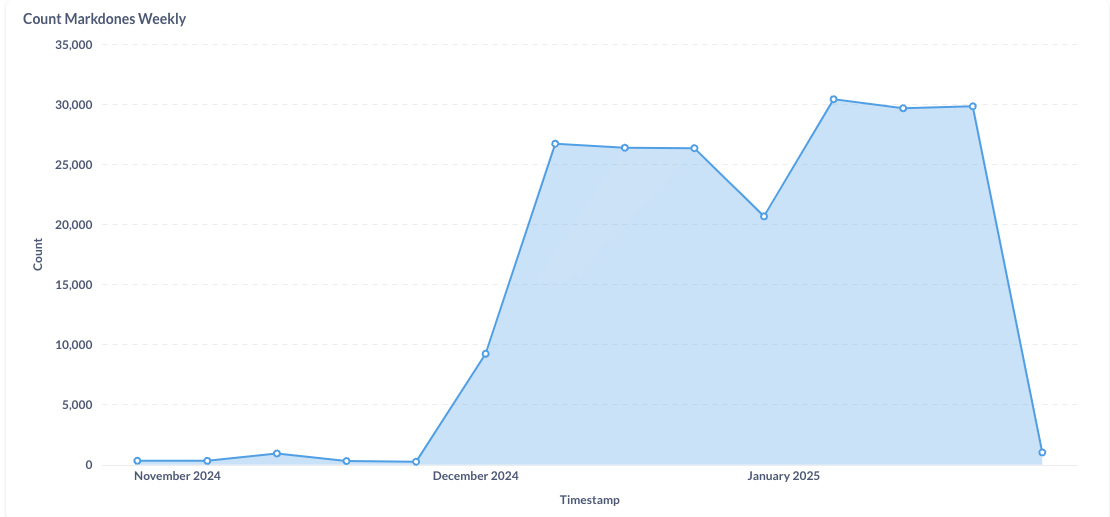
Count Markdones Weekly: Graph showing the number of markdones invoked in any playbook each week. Markdones can be invoked on their own or as a part of another action.
-
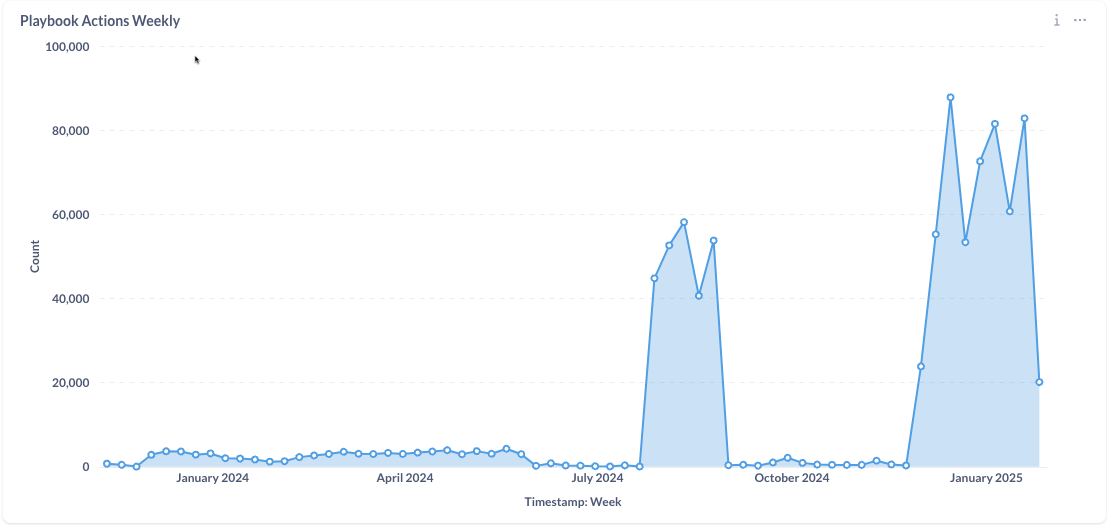
Playbook Actions Weekly: Graph illustrating the number of actions invoked in any playbook each week
-
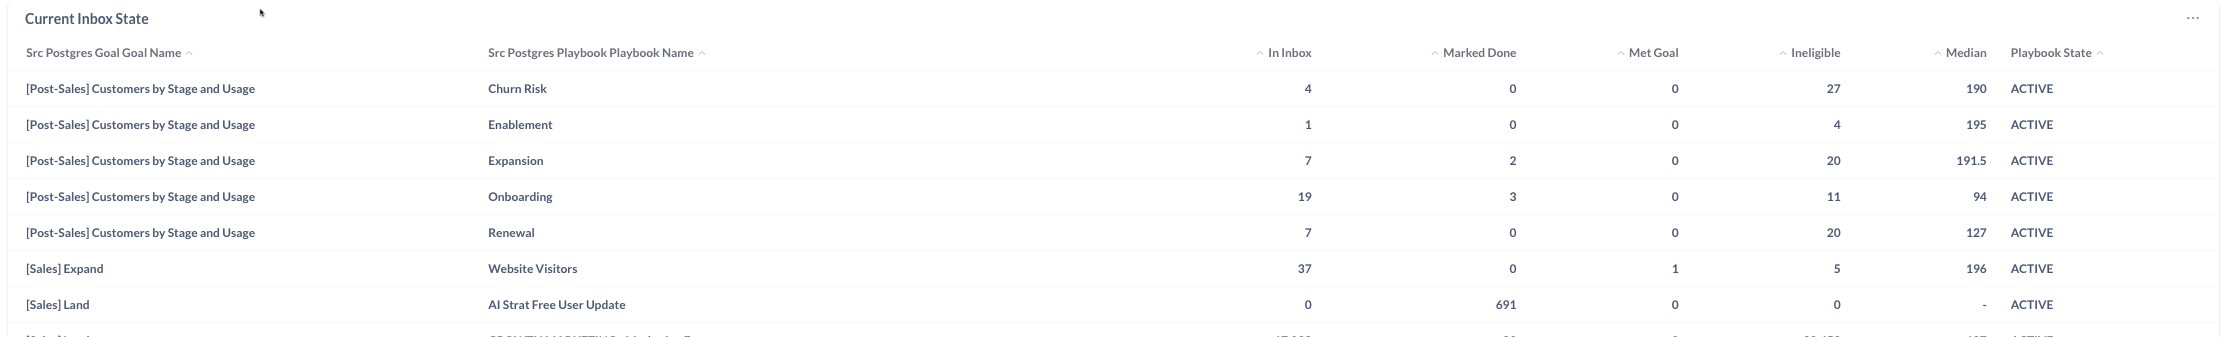
Current Inbox State: Snapshot showing details of current inbox state broken down by Goal and Playbook
-
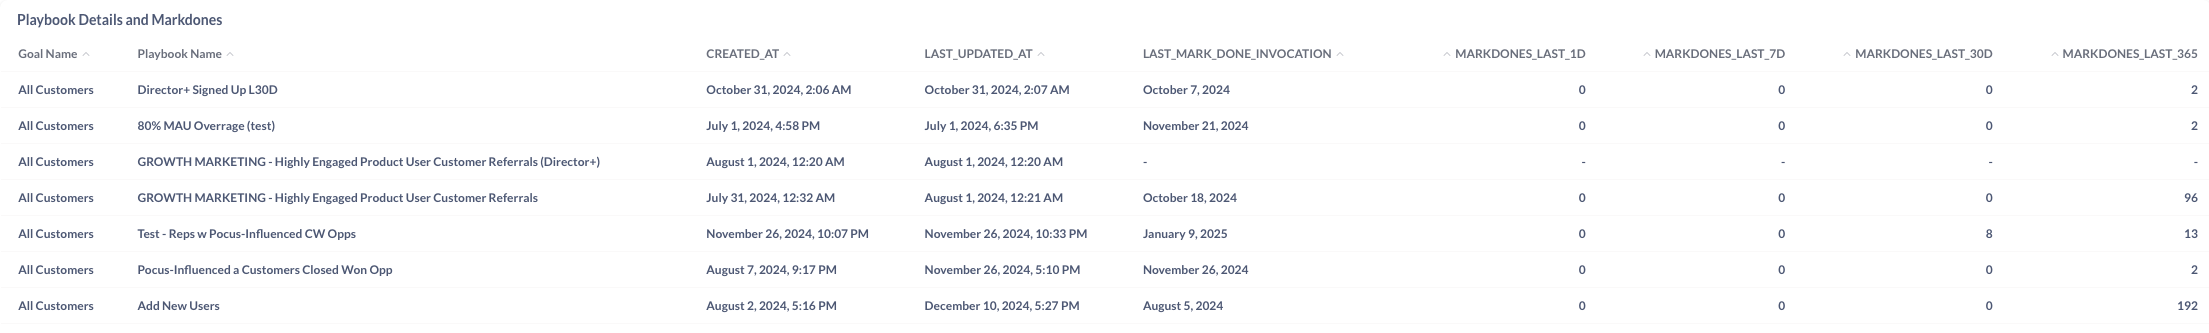
Playbook Details and Markdones: Detailed view of markdone activity broken down by Playbook
-
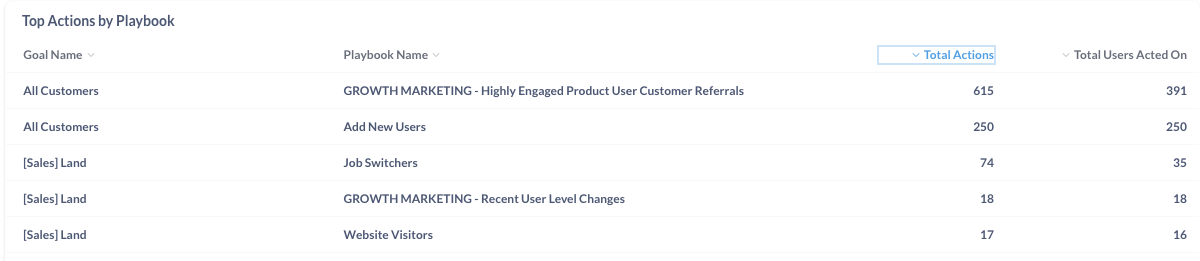
Top Actions by Playbook: View of total action counts by Playbook
-
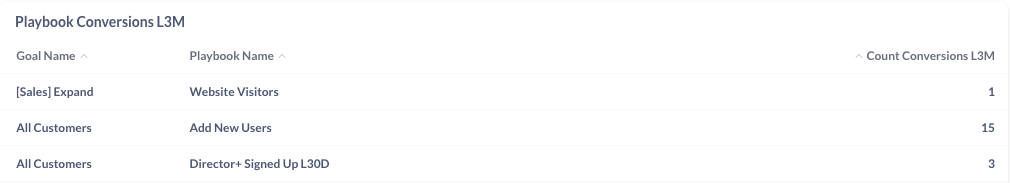
Playbook Conversions L3M: Number of items that entered each Playbook and then met the set Goal criteria over the last 3 months
-
Playbook Conversion Count L90D: Items Surfaced, Actioned, and Converted in the last 90 days. All paused and archived Playbooks have been excluded. Conversion occurs when an item in the Playbook meets the set Goal condition. (This can occur without user action.)

Available Metrics for Lists and Non-Playbook Analysis
This data can be leveraged to see what lists are most popular. This knowledge can be used to inspire new Playbooks!
-
Action Location Breakdown: Counts and percentages of where actions are being taken

-
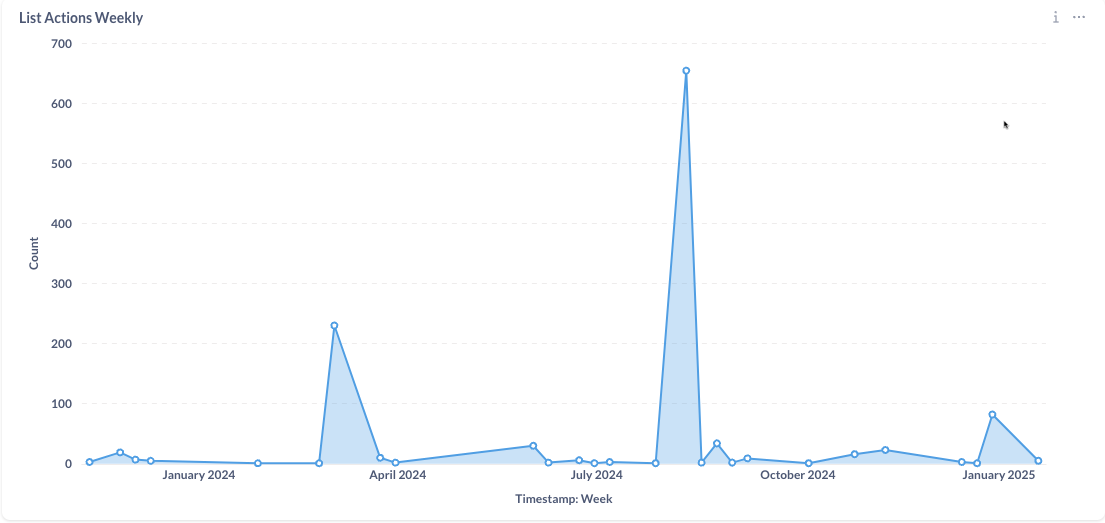
List Actions Weekly: Graph illustrating the number of actions being taken from lists (Enrollments, Link Opens, Snoozes, etc) each week
-
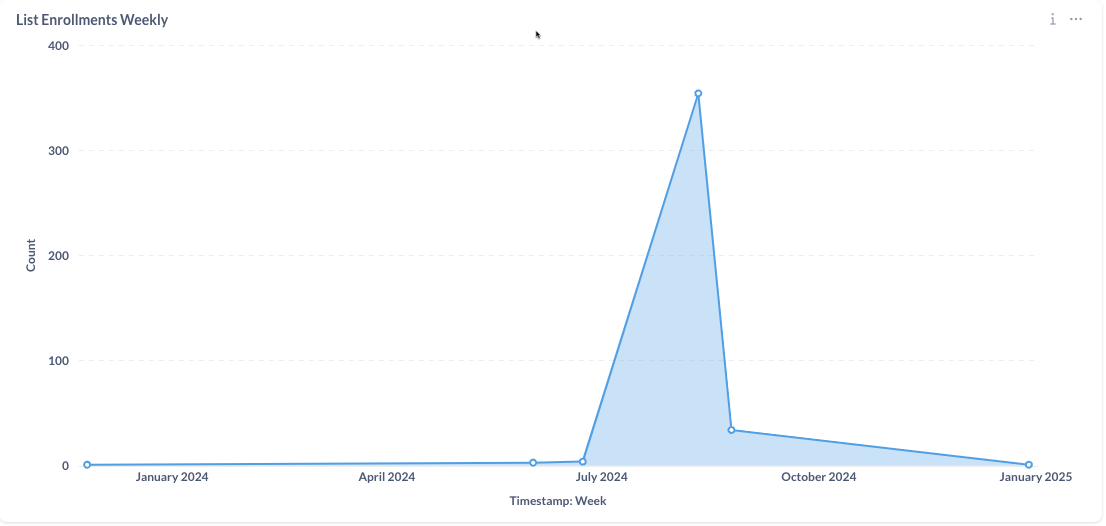
List Enrollments Weekly: Graph showing the count of all enrollment actions in a particular list week by week
-
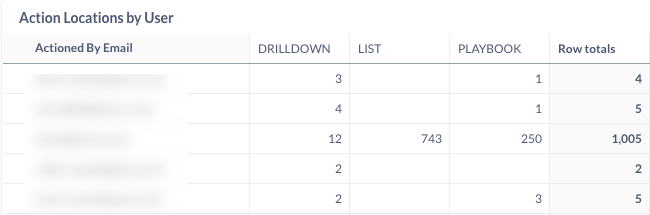
Action Locations by User: Counts by location where actions are being taken
-
List Activity: Shows what lists are the most actively used and by who